S-1015 Compaction Testing for Unbound Materials
Importance of Proper Inspection and Compaction Testing
Compaction Testing of Soils (1015.02)
Compaction Testing Requiring an Aggregate Correction (1015.03)
Compaction Testing for Granular Materials (1015.04)
Procedure for Constructing a Test Section Method A (1015.05)
Test Section Method B (1015.06)
Test Section Method C (1015.07)
Compaction Testing for Shale (1015.08)
Compaction Acceptance (1015.09)
Minimum Number of Tests (1015.10)
Sample Problems for Forms CA-EW-5 and CA-EW-6
Documentation Requirements – Supplement 1015 Compaction Testing of Unbound Materials
General
Supplement 1015 details the compaction testing requirements for all ODOT projects. ODOT technicians and testing personnel provided by the Contractor must follow the testing procedures described in S-1015.
When the Contractor will provide the compaction testing, one of two possible supplemental specifications will be included in the contract documents. The two supplemental specifications, SS-878 and SS-879, are similar, but SS-878 pays for the inspection and testing as a lump sum pay item, while SS-879 pays for the work by providing incentive pay to the contractor.
There is one compaction and inspection table for S-1015, SS-878 and SS-879. Table 1015.10-1 in Section 1015.10 includes columns for the materials, test or method, maximum lot size and minimum number of test. The same number and type of inspections and compaction tests are taken regardless of which specification is used in the contract.
SS-878 Inspection and Compaction Testing of Unbound Materials
This note is used when construction personnel are limited and the District wants full time inspection and compaction testing for the work.
SS-878 pays for the inspection and compaction testing as a lump sum pay item and covers Items 203, 204, 205, 206, 304, 307, 411, 503, 603 and MSE wall select granular backfill.
The major aspects of the specification are as follows:
1. The Contractor is to supply full time qualified inspection and compaction testing for all specified items.
2. The compaction tests are performed according to S-1015.
3. The documentation is performed on Department forms.
4. The documentation is presented to the Engineer daily and a summary report is required every two weeks.
5. There are qualifications requirements for the inspection and compaction personnel.
6. The Department will perform QA compaction tests.
7. There is a lump sum payment for this work.
8. Several Districts are using their own notes that require the Contractor to supply the compaction testing for a project. This supplemental specification requires comprehensive inspection and compaction testing for the work.
SS-879 QC/QA for Embankment Construction
The major aspects of the specification are as detailed below:
1. Several of the sections in this specification refer to SS-878 because they are basically the same work with the payment mechanism being different.
2. The Contractor supplies full time qualified inspection and compaction testing for Items 203 and 204.
3. The compaction tests are performed according to S-1015.
4. The documentation is performed on Department forms.
5. There are qualifications requirements for the inspection and compaction personnel.
6. The Department will perform QA compaction tests.
This supplemental specification is very similar to SS-878, except there is a pay adjustment plus or minus 4 percent to the amount bid for Items 203 and 204. This specification allows for more Contractor responsibility for the work with an appropriate incentive. It also allows the Department to reduce the amount of full time inspection of the work.
Metrication and Rounding
Most of the tables, forms, graphs, curves and tests in this section are in English and Metric units. The units are labeled with the English units first and the Metric units are in parenthesis, i.e., English (metric). All forms ending with an M are metric. (For example, CA-EW-5 is the English compaction form and CA-EW-5-M is the Metric form).
Weight measurements should be measured to the nearest 0.01 of a pound or kilogram. All calculations are normally recorded to the nearest 0.1 or 4 significant digits. Normally the final compaction results are recorded to the nearest percentage of compaction and acceptance is based on rounding. The rounding of 97.6 percent compaction is rounded up to 98 percent compaction, while 97.5 is rounded down to 97 percent compaction. The rounding of other calculations and measurements are done in a similar manner.
Importance of Proper Inspection and Compaction Testing
The Contractor constructs the embankment. As the representatives of the Department, our Inspectors and Engineers observe the work to ensure compliance with the specifications. As the Department inspects the work, we give instructions to the Contractor, such as the material is too dry, too wet, not enough stability or density.
What happens when an embankment fails and we determine that one of the following has occurred?
1. The instructions to the Contractor were in error.
2. Compaction tests were performed incorrectly.
3. Compaction forms were incomplete.
4. No inspection or part-time inspection occurred during the construction.
All of the above reasons are arguments that are issues during a claim. Valid or not, these are reasons that will be debated when responsibility is discussed. Considerable financial loss to the Department could result during these negotiations or in court because of any one of the above reasons.
Our goal with this section is to minimize the Department liability in the above claim situations.
In addition, compaction testing is an important evaluation tool that measures the quality of the earthwork construction work. Therefore, this entire section is dedicated to obtaining correct and accurate results.
Compaction of Soils (1015.01)
Moisture-Density Relationship (1015.01.A)
In order to understand compaction testing, the project personnel must first understand the moisture-density relationship and some of the variables associated with this relationship.
A relationship exists between the density of a soil and the moisture content of a soil as the moisture content is varied while the compactive effort remains constant. A standard force is used in the test that closely approximates the densities that can be readily obtained in the field with sheepsfoot rollers and other types of common compaction equipment. The greatest density obtained in the test is termed “maximum density” and the corresponding moisture content is termed “optimum moisture.” This moisture-density relationship is shown in Figure 1015.01.A.
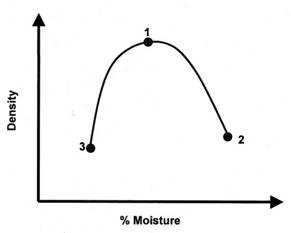
Figure 1015.01.A - Typical Moisture-Density Curve
The test used by the Department to determine the moisture-density relations of soil is AASHTO T-99, Method C. The basic principle involved in the moisture-density relationship is an important tool when evaluating a soil.
For a given force of compaction and given moisture content, a soil will have a corresponding density. Additionally, there is a particular moisture content for each soil at which a given compaction requirement can be obtained with less compaction effort than at any other moisture content. This moisture content is the optimum moisture content.
Structural properties of a soil vary with moisture content and density. For example, a clay soil at a low density will have very high load-supporting strength when dry, but when it is saturated at this same density it will have a very low load-supporting strength. Hence, when the structural properties of the soil are being determined, its moisture content and density must be defined and controlled to permit accurate evaluation of the soil in that particular condition.
Refer to Figure 1015.01.A to understand the influence of moisture on the compaction of soils. At point 3, the soil is compacted at a moisture content where the compactive effort cannot overcome the friction or resistance of the soil to achieve a maximum density. As the water content increases, the particles develop larger and larger water films around them, which tend to “lubricate” the particles and makes them easier to move about and reorient into a denser configuration.
However, as the moisture content is increased, we eventually reach point 1, where the density does not increase any further with water content. At point 1, the soil has just enough moisture to overcome most of the friction and not too much to have excess pore pressure to displace the soil.
As the moisture is increased from point 1 to 2, the density decreases as the water starts to displace and replace soil particles because of the excess pore pressure.
Making a Moisture-Density Curve (1015.01.B)
This section outlines procedures to determine the optimum moisture, maximum wet weight, and maximum dry weight of a soil, shale or granular materials. This data is used to determine the suitability of soil for use in embankment and subgrade and to establish a standard for field compaction control if needed.
The procedures outlined in this section follow AASHTO T-99, Method C with some minor modifications.
Equipment (1015.01.B.1)
The equipment needed to make a moisture-density curve is as follows:
1. Proctor Mold
a. Cylindrical brass or cadmium-plated steel mold approximately 4 inches (102 mm) in diameter, 4.5 inches (114 mm) in height and having a capacity of 1/30 ft3 (9.43 × 10⁻⁴ m3).
b. The cylinder is mounted on a removable base plate and fitted with a detachable collar approximately 2.5 inches (63 mm) in height.
2. Proctor Hammer
a. Brass or cadmium-plated steel sleeve rammer having:
i. A striking face 2 inches (50 mm) in diameter.
ii. Weighing 5.5 lbs (2.5 kg).
iii. Equipped to control the height of drop to 12 inches (305 mm).
3. Steel straightedge 12 inches (305 mm) long.
4. Scale of 25 lb (12 kg) capacity sensitive to 0.01 lbs (1 gram).
5. A 3/4-inch (19 mm) sieve.
6. Oil or gas stove or portable oven unless dried by other methods.
7. Baking pans, approximately 12 × 8.5 × 2.5 inches (300 × 200 × 63 mm).
8. Masonry trowel and putty knife.
9. If the test is performed in the field, use a large concrete block or piece of concrete beam.
a. Minimum size is a 12 × 6 inch (300 × 150 mm) cinder block.
b. Or a 4 × 12 inch (100 × 305 mm) solid concrete block.
c. Do not use wood or asphalt.
Procedure (1015.01.B.2)
Use the form in Figure 1015.01.B to record test data as obtained by the procedure outlined in this section. This form shows an example of recorded test data. Each column is lettered and used throughout this section to facilitate referring to the explanation.
1. Secure a representative sample of soil of about 40 lbs (20 kg).
2. Pass the sample through a 3/4-inch (19 mm) sieve.
3. Wet or dry the sample.
a. Change the moisture content to 4 to 6 percent below optimum.
b. See 1015.01.F, “Estimating Optimum Moisture” in this section for more information.
4. Make a proctor.
a. Make a specimen by compacting the prepared soil in the proctor mold.
i. Make three equal layers to give a total compacted depth of about 5 inches (130 mm).
b. Compact each layer by applying 25 uniformly distributed drops from the 5.5 lb (2.5 kg) rammer dropping from a height of 12 inches (305 mm) above the elevation of the soil.
c. See Figure 1015.01.D for recommended Loose and Compacted Soil Lifts.
i. Loose Lifts will change depending on the consistency of the soil.
d. Ensure that the cylinder is resting on a uniformly rigid foundation during the compaction.
i. Use a large concrete block or piece of concrete beam.
ii. The minimum size is a 12 × 6 inch (300 × 150 mm) cinder block.
iii. Or a 4 × 12 inch (100 × 305 mm) solid concrete block.
iv. Do not use wood or asphalt.
5. Remove the extension collar.
a. The soil should be less than ½ inch (13 mm) above the mold.
b. If the soil is lower than the top of the mold, repeat the test.
c. Carefully trim the compacted soil even with the top of the mold using the straightedge.
d. Add fine material to fill any voids if necessary.
i. Use the fines from the tested soil.
6. Weigh the cylinder and sample. Input this information in Column ‘A’
a. Calculate the density of the specimen by subtracting the weight of the mold from the weight of the specimen and mold, and multiply the difference by 30 for English units and 1060 for metric units.
i. Column A – 9.81 lbs = Column B
13.34 - 9.81 = 3.53
9.81 is the weight of the mold
ii. Column B × 30 = Column C
3.53 × 30 = 105.9
iii. Column C is the wet density of the proctor soil.
7. Remove the material from the mold and slice vertically through the center.
a. Take a representative sample of the material from one of the cut faces and determine the moisture content by a method outlined in section 1015.02.H “Alternate Tests for Moisture”.
b. If the only available scales are those included in the compaction control kit, a 1 lb (0.5 kg) sample is required for the moisture determination. However, if a more sensitive scale is available use a 0.22 lb (100 gram) sample. The smaller sample will dry faster.
i. The scales need to be leveled with a carpenter’s level. Put the scale on a piece of flat plywood then level the board. You may elect to level the weighting plate.
ii. The older scales must also be balanced once it is leveled. The weighting mechanism should float between the top and bottom bar. If it does not then sand or pebbles can be added to the lever arm to make it balance.
c. Calculate the dry weight and the moisture content as follows:
i.
Column D…Weight of the dish and the wet soil.
96.2
ii.
Column E…. Weight of the dish and soil after drying.
93.4
iii.
Column F…Column D - E = Weight of Water
96.2 - 93.4 = 2.8
iv.
Column H…Column E - G= Dry Soil Weight
93.4 – 40.0 = 53.4
v.
Column I…F/H × 100 = Percent Moisture
Water Content = Weight of Water /Dry Weight
(2.8/53.4) × 100 = 5.2%
vi.
Column J…C/(1+ I) = Dry Weight of the Soil
Dry Weight =Wet Weight/ (1 + Wc )
In the Example:
WD= 105.9/(1+0.052) = 100.5
8. Thoroughly break up the remainder of the material until inspection shows that it will pass a ¾ inch (19 mm) sieve. It is not necessary to pass all of the material through the sieve.
9. Add water in sufficient amount to increase the moisture content of the soil sample by 2 or 3 percent, and repeat the procedure outlined in D through H.
10. Repeat D through H, each time adding water until you obtain at least 4 readings for the wet weight, dry weight and moisture content.
a. Continue the process until a minimum of two points are plotted on the wet and dry side of the dry weight curve and there is a decrease in the wet weight.
11. Use Figure 1015.01.C (1015.01.C-M) as an example and plot test data as follows:
a. Plot wet weight, ‘Column C’ versus moisture content, ‘Column I’ of the successive tests on linear graph paper.
i. Draw a smooth curve between the successive points.
ii. The peak of this curve is the maximum wet weight of the material being tested.
iii. This maximum weight is not used for compaction acceptance.
b. Plot dry weight, ‘Column J’, versus moisture content, ‘Column I’, of the successive tests on linear graph paper.
i. Draw a smooth curve between the successive points.
ii. The peak of this curve is the maximum dry weight of the soil.
iii. The moisture content at this point is the optimum moisture.
iv. This curve can be used for compaction acceptance.
Figure 1015.01.C (1015.01.C-M) shows curves plotted from the test data in Figure 1015.01.B.
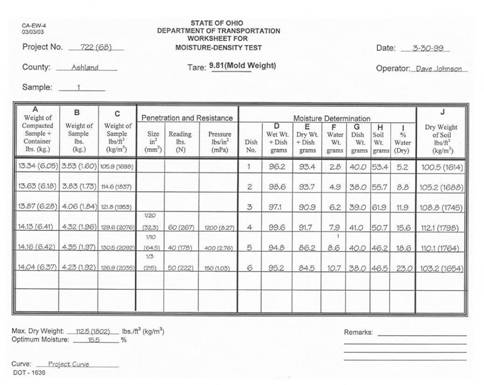
Figure 1015.01.B – Moisture-Density Calculation Form
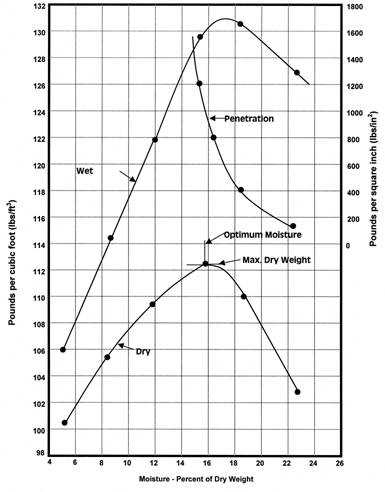
Figure 1015.01.C – Moisture-Density Curve Plot
Figure 1015.01.C-M – Moisture-Density Curve Plot (metric)
Figure 1015.01.D - Loose and Compacted Lifts for the Proctor Test
Ohio Typical Density Curves (1015.01.C)
The Ohio Typical Density Curves are a set of soil curves originally developed in the 1930’s and 1940’s to represent all the soils in Ohio. They were developed in the laboratory using the standard proctor test. They started with an original set of nine curves that represented over 1,000 samples. Additional curves were added that represent over 10,000 lab samples. These curves are plotted in Figure 1015.01.E. These curves are still used today to represent all the soils in Ohio. Using these curves minimizes the need to make moisture-density curves for each type of soil encountered in the field.
Figure 1015.01.E - Ohio Typical Density Curves
A one-point proctor test is used to choose the curve that represents the soil under consideration. The procedure is similar to the AASHTO T 272 test and is detailed in Supplement 1015.02.A in section 1015.02.F of this manual.
Usefulness of the Moisture-Density & the Ohio Typical Density Curves (1015.01.D)
By examining the moisture-density or the Ohio typical density curves, one can gain general information on the load-carrying capacity and other information about the soil properties.
The optimum moisture and maximum density of the moisture-density relationship are comparative factors. A high maximum density ranges from 125 to 140 lbs/ft3 (2000 to 2250 kg/m3) dry weight. A low maximum density ranges from 100 to 85 lbs/ft3 (1600 to 1350 kg/m3) dry weight. A low optimum moisture coincides with a high maximum density and will be on the order of 7 percent. A high optimum moisture coincides with a low maximum density and may be on the order of 25 percent.
The maximum density of a soil gives approximate information on its gradation and soil type. The approximate range of the maximum dry density for particular soils are as follows:
|
Soil Type |
Typical Maximum Dry Density |
|
A-1 & A-2 |
120 to 135 (1922 to 2163) Granular Soils |
|
A-2 |
120 to 130 (1922 to 2082) Granular Soils |
|
A-3 |
110-to 120 (1762 to 1922) Granular Soils |
|
A-4 |
105 to 120 (1682 to 1922) Silty Soils |
|
A-6 & A-7 |
90 to 110 (1442 to 1762) Clayey Soils |
The optimum moisture gives approximate information on the clay and silt content of the soil. The shape of the moisture-density curve varies from a sharply peaked parabolic curve to a flat one or to one sloping irregularly downward as the moisture content increases. This shape gives additional valuable information showing the influence of moisture on the load-supporting value of the soil. For example, a flat moisture-density curve indicates a soil that will have about the same load-supporting strength over a wide range in moisture contents, while a moisture-density curve with a sharp peak indicates a soil that is sensitive to changes in moisture content.
Variations in the Moisture-Density Relationship (1015.01.E)
To truly understand the moisture and density relationship as it relates to soil compaction, the project personnel should understand what items affect this relationship. This section briefly addresses these issues.
This moisture-density relationship is affected by, but not limited to, the following conditions:
1. A change in the laboratory compactive effort, or a field compactive effort that is different from the laboratory testing compactive effort.
2. A temperature of the compacted soil that is near or below freezing temperature.
3. Coarse aggregate that is added or subtracted from the soil.
Changing the Compactive Effort (1015.01.E.1)
The AASHTO T 99 proctor test used to make the Department’s moisture-density curves was originally made to simulate field compaction conditions. It uses a standard compactive effort that allows us to evaluate and compare the compaction and densities of different soils. What happens to this moisture-density relationship as you increase or decrease this compactive effort?
In Figure 1015.01.F, the compactive effort may be increased or decreased to change the maximum density as much as 10 to 15 lbs/ft3 (160 to 240 kg/m3). As the compactive effort increases, the curve shifts to the left and up along the same line of optimum. If the compactive effort is lowered, the compaction curve shifts to the right and down.
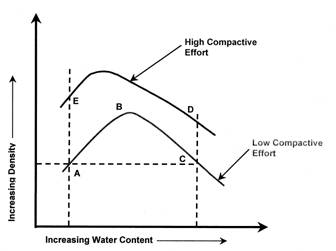
Figure 1015.01.F - Changing the Compactive Effort
Temperature Effects on Soil (1015.01.E.2)
If a soil is compacted at low temperatures, the maximum density cannot be achieved in the field. The specifications do not allow soil to be compacted that is frozen. In Figure 1015.01.G shows why this is the case. The maximum density can change as much as 10 lbs/ft3 (160 kg/m3) for soils compacted at temperature differences of 40º F (20º C). But, there may not be any difference in maximum density at all. Temperatures affect some soils but not others. There is not a formula that takes this temperature difference into consideration.
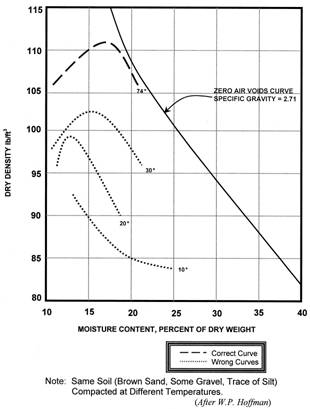
Figure 1015.01.G - Temperature Effects on the M-D Curve
Compaction procedures must be altered to check for this difference. Use the following procedure when the Contractor is compacting the soil at temperatures lower than 45º F (7º C) or when the site conditions warrant:
1. Take the normal proctor test during the compaction testing. Choose the curve associated with this compaction test.
2. Take enough soil from the same hole to make another proctor later. After the soil is warmed to approximately 70º F (21º C) make an additional proctor. Pick an additional curve using the wet weight of the second proctor and moisture content from a drying method.
3. Compare the two results and use the higher curve if there is a difference. Use this procedure at any time the material is suspect in the field.
Coarse Aggregate Problem (1015.01.E.3)
The moisture-density relationship is very good for soils passing the ¾ inch (19 mm) sieve as it relates to the field compaction of soils. There are problems when this relationship is extrapolated to soils larger than the ¾ inch (19 mm) sieve material or for granular soils. Corrections must be made to account for these materials. In certain circumstances, field densities do not correspond to the laboratory results. These will be pointed out in later sections.
Figure 1015.01.H details a plot of adding or subtracting coarse aggregate to a soil and the resulting change in the moisture-density curves.
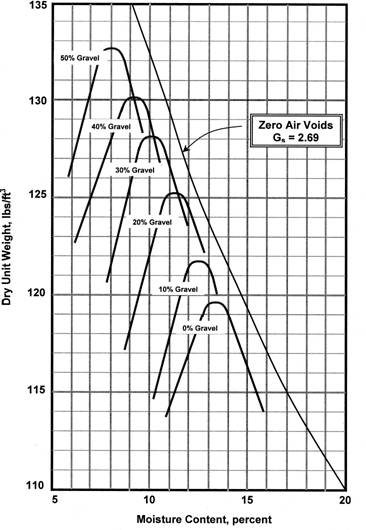
Figure 1015.01.H - Coarse Aggregate Effects on Soil M-D Curve
As you add gravel or plus ¾ inch (19 mm) material to the soil, the optimum moisture shifts to the left and the maximum density increases. The average increase in density is approximately 1 percent per 10 percent of material retained on the ¾ inch (19 mm) sieve. This effect is taken care of on the compaction form CA-EW-6 and is fully explained in Section 1015.03 in this manual.
If you sieve the material through the ¾ inch sieve, remove 20 percent coarse aggregate, and do not consider this, you could easily be one or two curves lower than intended.
Use the correction on the CA-EW-6 compaction form where more than 10 percent of the material is retained on the ¾ inch (19 mm) sieve. This correction usually increases the maximum density and also an optimum moisture correction is made.
Importance of Temperature and Coarse Aggregate Corrections (1015.01.E.4)
The accuracy of all compaction testing is important. But, the importance of making temperature and coarse aggregate corrections in the compaction testing are less obvious to the project personnel. Without these corrections the compaction testing could easily be off by more than 2 lbs/ft3 (32 kg/m3) without the project personnel being aware of a problem.
If the compaction testing is off by 2 lbs/ft3 (32 kg/m3), or approximately one Ohio Typical Density Curve, this may result in a loss of 15 percent of the soil strength. If the testing is off by two curves, the potential loss could be 30 percent, and so on. The strength may not be apparent in construction, but in the long term it may have devastating effects on the performance of the embankment.
Estimating Optimum Moisture (1015.01.F)
Soil Boring Interpretation Method
All cohesive soils are compacted at water contents less than the plastic limit of the material. For A-7-6 soils, the optimum moisture content is around the plastic limit minus 3. For A-4 and A-6 soils, the optimum is around the plastic limit minus 5. The optimum moisture content of granular materials ranges between 5 and 10, and for non-plastic silts is around 11.
You can obtain an estimate of the consistency of the material by using the above information and looking at the soil’s water content from the soil borings before the work begins. Keep in mind the water content on the soil borings is the water content at the time the borings were drilled. They should be considered an estimate of the present field conditions.
You can approximate the optimum moisture of a material by the feel of the material in the field, using one of the following methods.
Hand Squeeze Method
Take a sample of the material in question in your hand.
Squeeze the material together and let go.
Consult the following table:
|
If the material… |
Then material is… |
|
Falls apart in small pieces |
Dry of optimum |
|
Stays together |
At or above optimum |
|
Breaks into two or three large pieces |
At optimum |
|
Stays together and there is excess water on hands |
Above optimum |
Ball Method
Roll the material into a one-inch ball.
Place it between your thumb and index finger and squeeze the material.
Consult the following table:
|
If the material… |
Then material is… |
|
Ball cannot be formed |
Below optimum |
|
Becomes oval |
Above optimum |
|
Breaks apart into uniform pieces (Some clays will have larger pieces than silts) |
At optimum |
Spit Method
Spit on the material.
Consult the following table:
|
If the saliva… |
Then material is… |
|
Beads up |
Above optimum |
|
Slowly sinks in |
At optimum |
Use these methods as estimates; they do not replace compaction testing. These estimates are different for each type of soil (clay, silt, granular).
Compaction Testing of Soils (1015.02)
General (1015.02.A)
Proper compaction at the proper moisture is the most effective and most economical way to improve the stability of soils. Satisfactory performance of pavement and embankment depends on the good compaction of the embankment and subgrade materials. Careful control is necessary to ensure compliance with the specification compaction requirements for embankments and subgrades.
The density test is the principal means by which the Engineer determines whether or not the specified compaction requirements have been met. The number of tests to be made for a given quantity of embankment material placed is set by Supplement 1015.10. The Engineer has broad powers to increase or decrease this testing depending on the field conditions. The Engineer may use his or her judgment to make tests at locations where the information is most needed for proper control.
For example, consider an area of embankment under construction where the soil and moisture conditions are uniform and ideal for good compaction, and where previous compaction tests have shown that the specification requirements are being met consistently under the same number of roller passes. As long as inspections show that the uniform conditions of soil, moisture, lift thickness, and roller pass continue for this area, only occasional check tests for compaction are required.
Where relatively few tests are made because materials and conditions are uniform, document this by describing conditions on the Compaction Forms or other appropriate project records. Avoiding a large number of tests in areas of uniform condition where specified compaction is consistently obtained allows the project personnel to concentrate their effort on other areas of the project where conditions are less uniform or suspect.
Tests must be made in areas where inspection indicates that the material is questionable even if specified compaction is being obtained. Evidences of questionable compaction, which can be determined by inspection, include the following:
1. Low number of roller passes to obtain compaction.
2. Excessive deflection under heavy construction equipment.
3. Using lightweight rollers.
4. Very wet or dry soil.
5. Areas compacted without full time inspection.
6. Inconsistent materials, such as shale and rock mixtures, or recycled concrete mixed with soil.
The observation that a sheepsfoot roller will “walk out” or “ride high” on a layer of hard, dry soil is not evidence of satisfactory compaction. This soil may be stable when dry but weak when wet.
Areas where it has been determined that compaction or moisture does not meet specification requirements must be corrected before the next lift of embankment is placed.
The Engineer must give specific directions to the inspectors. These directions must cover the inspector’s responsibility and authority given to them by the Engineer. This ensures that timely decisions are made in the field and that full compliance with the contract requirements is obtained on the project.
Control of compaction includes making moisture and density determinations for establishing whether the compaction meets the requirements prescribed in the specifications.
A sufficient number of tests must be made to ensure that construction complies with the specifications. The nuclear gauge method is the only method used for compaction testing. The sand-cone, rubber-balloon, and cylinder density tests have been eliminated.
Regardless of the method chosen, a one-point proctor test is used to identify the curve that represents the soil in question for each compaction test, except for materials requiring a test section.
Equipment (1015.02.B)
1. Equipment listed in Section 1015.01.B.1.
2. A 3-inch (75 mm) or 4-inch (100 mm) post-hole auger.
3. A container with a 4.5-inch (114 mm) hole cut in the bottom.
4. Troxler 3440 Nuclear Gauge.
5. 25 to 50 lbs (12 to 23 kg) of dry uniform natural sand passing the No. 10 (2 mm) sieve.
6. Form CA-EW-5, “Nuclear Gauge Compaction Form” and Form CA-EW-6 Nuclear Gauge Compaction with an Aggregate Correction.
Preparation of Test Site (1015.02.C)
Select a location for the density test that is representative of a rolled area of the embankment layer being constructed. If loose, uncompacted material, such as results from sheepsfoot rolling, exists on the surface, remove the loose material to expose the compacted material underneath. Carefully level the test area by any convenient means, such as a dozer, grader, hand shovel, straightedge, etc.
Compaction Testing of Soil Using a Nuclear Gauge (1015.02.D)
The Department uses nuclear equipment manufactured by Troxler Laboratories. Presently the Department uses the 3440 series gauges. The operator should have a Manual of Operation for the gauge.
There is no radiological danger for the operation of a nuclear gauge so long as the correct operating and safety rules are followed. Each operator is issued a specific set of instructions governing safety when the gauge is assigned to him or her. For more information about the safety requirements see the following link to the Nuclear Labs Web site:
www.dot.state.oh.us/Divisions/ConstructionMgt/Materials/Pages/Radiation-Safety.aspx
In addition, contact the Nuclear Lab at (614)275-1375 for more information.
For nuclear measurement of density, gamma rays emitted into the soil from a gamma source are scattered by the electrons in the soil and lose energy in the process. The number of scattered rays returned and counted in the gauge depends on the average length of the path of the ray between the detector and source. The electron density increases proportionally with the density of the soil and causes greater scattering and energy loss. Therefore, the chances that scattered gamma rays returning to the detector with sufficient energy to be counted become smaller with increased soil density, and the count rate drops. In common types of soils, a low gamma ray count indicates a high density, and a high count indicates a low density.
For nuclear measurements of moisture, the neutron energy absorption technique measures the moisture content of rock or soil materials. The nuclear method for measuring the moisture content of soil and rock materials is based on the principle of measuring the slowing of neutrons emitted into the soil from a fast-neutron source. The energy loss is much greater in neutron collisions with atoms of low atomic weight, and is directly proportional to the number of such atoms present in the soil. The effect of such a collision is to change a fast neutron to a slow neutron. Hydrogen, which is the principal element of low atomic weight found in soils, is contained largely in the molecules of water in an inorganic soil. The number of slow neutrons detected by the gauge, after an emission of fast neutrons from a radioactive source, is counted electronically in the gauge. The count obtained by the gauge is proportional to the amount of water in the soil or rock.
Density and moisture determinations can be made in any of the following two positions relative to the material being tested:
1. Backscatter - Source and detector in the gauge are resting on the surface of the material being tested.
2. Direct Transmission - Source in the rod is extended below the gauge into the material being tested, and the detector in the gauge is on the surface of the material being tested.
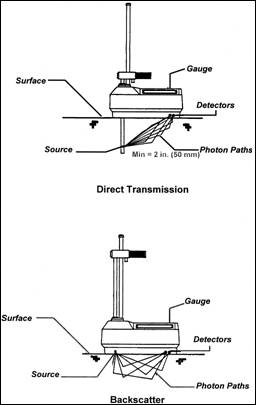
Figure 1015.02.A - Nuclear Gauge Direct and Backscatter Positions
Moisture-Density Testing (1015.02.D.1)
Use form CA-EW-5 or CA-EW-6 for moisture-density testing when using a nuclear gauge. The following is a summary of the gauge operations when testing soils. Consult the owner's manual of procedures more detailed explanation. The gauge is self-driven throughout the process. The operator pushes a button and the gauge asks a question or gives an answer.
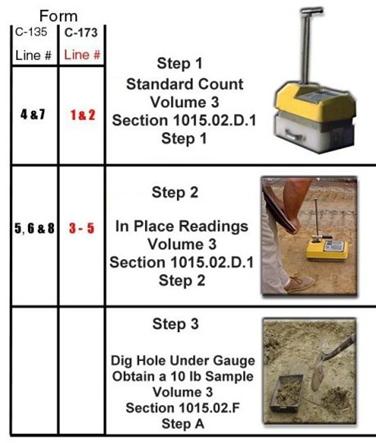
1. Determine the standard count
a. Perform at least every week or when the test location changes.
b. Put the gauge on the standard block with the handle opposite the metal plate. See Figure 1015.02.B.
Figure 1015.02.B - Nuclear Gauge on the Standard Block
c. Make sure the standard block is resting on material which weighs more than 100 lbs/ft3 (1600 kg/m3).
d. Press the "ON" button on the gauge panel (see Figure 1015.02.C).
i. Wait approximately 4 minutes for the gauge to "warm up."
ii. Gauge may already be on prior to placing it on the block.
iii. The gauge will beep when ready.
Figure 1015.02.C - Nuclear Gauge Keypad
iv. Readout:
1. Depth: Safe Position
2. Time: 1 min. (possibly a longer duration)
3. Battery: Volts
e. Press the Standard Button:
i. Readout
1. Do you want to take a new standard?
2. Press "YES"
3. Is the gauge in the safe position?
4. Press "YES"
ii. Readout:
1. Taking a standard count.
2. Takes 240 seconds.
3. Gauge will beep when complete.
iii. Readout when standard count is complete:
1. MS XXXX X.X%P
2. DS XXXX X.X%P
3. P-Pass, F-Fail
4. If reading is within 1% for density or 2% for moisture, the standard passed.
f. Record standard count on lines 4 and 7 on the CA-EW-5 and lines 1 and 2 on the CA-EW-6.
g. Do you want to accept the new standard?
i. Press "YES" if acceptable.
ii. Readout
1. Ready
2. Depth
3. Volts
4. Ready to take the readings.
2. Taking Nuclear Gauge Readings
a. Clear away all loose material or dried crust.
i. Obtain a level area with sufficient size to accommodate the gauge.
ii. Use the scraper plate to help smooth out the surface.
iii. See Figure 1015.02.D
Figure 1015.02.D - Scraper Plate and Use
b. Use the native fines or fine sand to fill the voids to finish smoothing out the surface.
i. The maximum void beneath the gauge should not exceed 1/8 inch (3 mm).
c. Make a hole perpendicular to the prepared surface by using the pin (drill rod) provided by the manufacturer.
i. Drive 2 inches (50 mm) further than the depth of the reading.
d. Mark the outside of the scraper plate.
e. Remove the scraper plate and position the nuclear gauge on the prepared location.
i. Raise the gauge up on one side and extend the rod out about 2 inches (50 mm).
ii. Place the rod over the hole and extend the rod the rest of the way.
f. Extend the rod to the required depth. See Figure 1015.02.E.
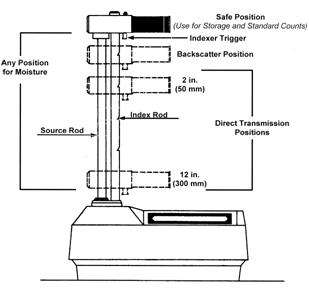
Figure 1015.02.E - Positions of the Nuclear Gauge
i. Backscatter Position is used for:
1. Bases.
2. Granular Materials.
3. Materials requiring a Test Section.
ii. 8-inch (200 mm) depth used for Embankment.
iii. 12-inch (300 mm) depth used for Subgrade.
iv. The gauge gives the depth.
v. The deepest depth is the most accurate.
g. Pull the gauge toward the detector end or away from handle to seat the gauge into position (see Figure 1015.02.A).
i. Eliminates the air gap between the source rod and the hole.
h. Press "START/ENTER".
i. After one minute:
i. Readout
1. DD = Dry Density = Line 6= 133.0 lbs/ft3
2. WD = Wet Density = Line 5 =144.4 lbs/ft3
3. % M = % moisture = Line 8 = 8.3%
j. Record information on Lines 5, 6, and 8 of the CA-EW-5 Form and on lines 3, 4, and 5 on the CA-EW-6 Form.
k. See Figure 1015.02.F
i. DD = Dry Density = Line 6= 133.0 lbs/ft3
ii. WD = Wet Density = Line 5 =144.4 lbs/ft3
iii. % M = % Moisture = Line 8 = 8.3%
Using the Ohio Typical Curves (1015.02.E)
Optimum moisture and maximum dry weight can be determined from the proctor test results, nuclear gauge results, and the Ohio Typical Density Curves as described in Section 1015.01.C and 1015.01.D. Use the Plotted Ohio Typical Density Curves for the compaction testing, that are in the Forms section of this manual.
Once the wet weight and percent moisture is obtained from the proctor test, it can be used to find the curve that represents the soil being tested. Use nuclear method or drying method to determine percent moisture in lieu of the penetration resistance method; do not use the penetration resistance method.
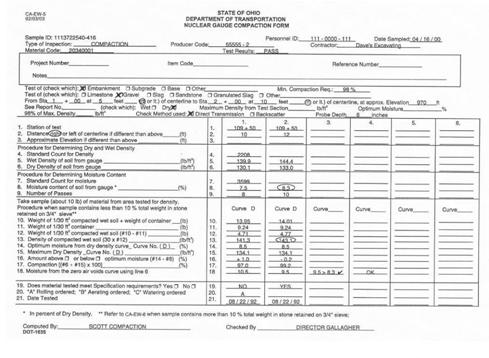
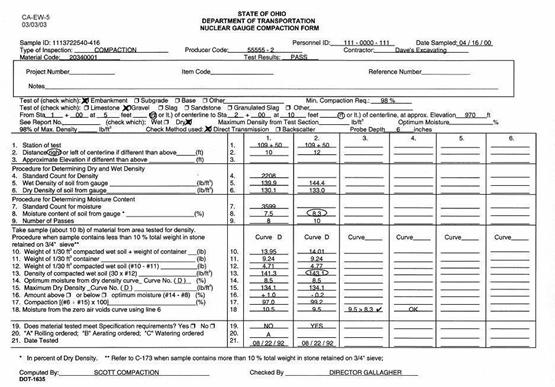
Figure 1015.02.F - Completed CA-EW-5 Compaction Form
Selecting a Typical Curve Using the Nuclear Gauge Results (1015.02.F)
1. Secure a representative soil sample of about 10 lbs (5 kg).
a. Use the soil between the end of the probe and the back of the gauge (see Figure 1015.02.A).
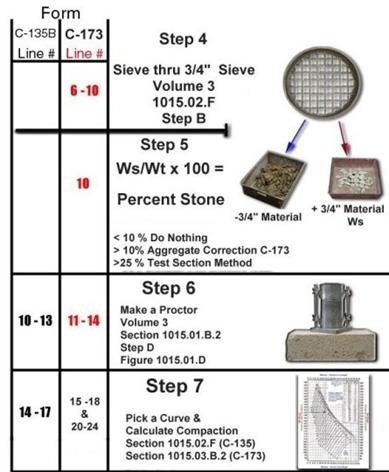
2. Sieve the material through a 3/4 inch (19 mm) sieve.
a. Use Form CA-EW-5 if less than 10% of the soil is retained.
b. Use Form CA-EW-6 if more than 10% of the soil retained.
c. Use a Test Section Method if more than 25% is retained.
3. Thoroughly mix the material passing the 3/4 inch (19 mm) sieve.
4. Make a Proctor using section 1015.01.B.2 of this manual.
a. Make a proctor test for every compaction test (a soil cannot be correctly identified without this test).
b. When weighing the proctor mold and soil, the scales must be level and balanced.
i. The scales need to be leveled with a carpenter’s level. Put the scale on a piece of flat plywood then level the board. You may elect to level the weighting plate.
ii. The older scales must also be balanced once it is leveled. The weighting mechanism should float between the top and bottom bar. If it does not then sand or pebbles can be added to the lever arm to make it balance.
5. Record and calculate the ‘Proctor’ results on Lines 10 through 13 on the CA-EW-5 and lines 11-14 on the CA-EW-6.
a. Use Figure 1015.02.F
b. Line 10 (14.01 lbs) – Line 11(9.24 lbs) = Line 12 (4.77 lbs)
c. Line 12 (4.77 lbs) × 30 = Line 13 (143.1 lbs/ft3)
6. Pick the Wet Weight Curve Using
a. The proctor wet density.
b. Line 13 = 143.1lbs/ft3
c. Moisture from gauge readings or by another drying method.
d. Line 8= 8.3%
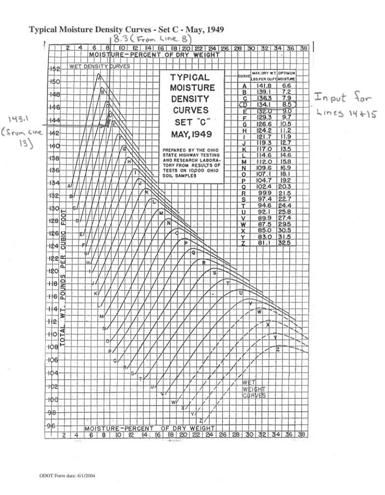
7. Use the printed Ohio Typical Density or Project Curves (see Figure 1015.02.G).
a. Draw a horizontal line through the wet weight per cubic foot (cubic meter) on the Ohio Typical Density Curves from the proctor weight on Line 13 on the CA-EW-5 or Line 14 on the CA-EW-6 Form.
i. Line 13 = 143.1 lbs/ft3
b. Extend a vertical line from the percent moisture shown on Line 8 on the CA-EW-5 or Line 5 on the CA-EW-6 Form, to intersect the horizontal line.
i. Line 8 = 8.3%
Figure 1015.02.G - Example of Using the Ohio Typical Density Curves
c. If the intersection falls on a curve, choose the curve.
d. If the intersection falls between two curves, choose the next highest curve.
8. Use the Maximum Dry Weight and Optimum Moisture data in the upper right hand corner of Figure 1015.02.G from the curve that is chosen.
a. In this example curve ‘D’ is the correct curve.
9. After the curve is selected, record optimum moisture on Line 14 and the maximum dry density on Line 15 of Form CA-EW-For the CA-EW-6 record the optimum moisture on Line 15 and the maximum dry density on Line 18.
a. Line 15 = Maximum Density = 134.1 lbs/ft3
b. Line 14 = Optimum Moisture = 8.5%
Calculating Compaction and Zero Air Voids (1015.02.G)
Use Figure 1015.02.F
1. Use line 16 to calculate the difference in moisture contents.
a. Line 14 = 8.5% - Line 8 (8.3%) = - 0.2% (below optimum)
2. Use line 17 to Calculate Compaction.
a. (Line 6/ Line 15) × 100 = (133.0 lbs/ft3/ 134.1 lbs/ft3) × 100 = 99.2%.
3. Compare to the allowable in the specifications shown in Table 203.07-1.
Table 203.07-1 Embankment Compaction Requirements
|
Maximum Laboratory Dry Weight (lb/ft3 ) |
Minimum Compaction (percent) |
|
90 to 104.9 |
102 |
|
105 to 119.9 |
100 |
|
120 and more |
98 |
a. Since Line 15 = 134.1 lb/ft3 > 120 the minimum required compaction is 98%.
b. Line 17 = 99.2% > 98
c. The test passes.
4. If density and stability are achieved, then moisture passed.
a. See Procedures Manual Section 203.07.
5. Check zero air voids.
a. Use Figure 1015.01.02.H.
b. Use line 6 = 133.0
i. Get 9.5
c. 9.5% > Line 8 = 8.3%
d. Good (Line 8 may be a maximum of 1% above the Figure 1015.02.H value.)
Can calculate the percentage by using the formula in Figure 1015.02.H
i. Where G=2.67 and D = line 6
ii. The formula is much easier to use than the graph if you are good with math.
6. The check on the zero air voids is a check on the nuclear gauge readings. The moisture obtained from the curve or graph is the maximum moisture that can exist in the soil being tested. If the gauge moisture readings are larger than the ones obtained from the graph then an error may exist in the test.
Figure 1015.02.H - Zero Air Voids Curve
Moisture Controls (1015.02.H)
Moisture Control of Soil Embankments during Construction (1015.02.H.1)
This section discusses moisture controls during construction, details some of the variables in the moisture controls, and discusses alternate methods used to verify or modify the moisture readings from the nuclear gauge.
Experience has shown that to obtain the specification density, the moisture content must be at or near optimum. Some soils, particularly silty soils with low plasticity, may meet the moisture (± 3 percent from optimum) and the compaction requirements but have unsatisfactory stability.
Some soils compact better and meet the density and stability requirements at minimum moisture of -3 or more below optimum. The reason for limiting the moisture contents for soil embankment this way is to ensure stable embankments.
The “Elasticity and Deformation of Soils” is discussed in Section 203.02 and “Moisture Controls” are discussed in Section 203.07.A of this manual.
There is not a numerical moisture requirement in the specifications. The Contractor must compact the material at a moisture content to obtain the density and stability of the material. Moisture and compaction controls are necessary to secure the quality of embankments and subgrades that are essential for the long life and performance.
Alternate Tests for Moisture (1015.01.H.2)
The specifications do not numerically limit the moisture content of embankment or subgrade soils. Moisture determinations must be made in the field to pick the required moisture-density curve and to control the Contractor’s compaction operations. The following sections deal with various methods of determining moisture contents of soils.
For engineering purposes, the moisture of soil is expressed in percent of dry weight.
|
Percent Moisture = |
Weight of water in soil |
× 100 |
|
Weight of dry soil |
Most of the time, the moisture of a soil should be obtained by using the nuclear gauge readings. However, there are situations where drying methods can and should be used. Moisture content is the most variable reading from the nuclear gauge. There are varieties of chemicals in the soils that can minimize the moisture content reading reliability. This is particularly true for recycled materials such as fly ash, bottom ash, foundry sand, or asphalt.
Use the moisture estimating principles detailed in section 203.02, “Estimating Optimum Moisture.” This section guides the determination of an alternate moisture measurement.
For each drying method the soil to be tested should be a representative sample of at least 1 pound (0.5 kilograms). The soil should be placed in a small, clean can or jar and covered with a tight lid at the construction site, to prevent evaporation of moisture while moving to the location of the test. The test should be conducted as soon as possible after taking the sample. Location where sample is taken must be noted.
All the moisture tests should be checked against each other to ensure accuracy of the moisture testing. To record the moisture results use Figure 1015.01.B, “Moisture-Density Calculation Form” and read the appropriate sections.
Oven-Drying Method (1015.02.H.3)
This method of determining moisture content is applicable to all types of soils. The time required to dry the sample depends on the size and moisture content of the sample and the type of soil.
This method should be used for any recycled material. This can be used to apply a moisture correction to the nuclear gauge readings when the material is uniform. This is particularly true for fly ash.
Equipment
1. Two-burner stove. Either oil stove or a camp stove using white gasoline.
2. “Boss 75” portable oven, or equivalent.
a. This oven measures approximately 20 inches (0.5 meters) high, 20 inches (0.5 meters) wide and 13 inches (0.3 meters) deep.
b. It sets on and is heated by the stove.
3. Several baking pans approximately 12 × 8.5 × 2.5 inches (300 × 200 × 63 mm).
4. Masonry trowel or putty knife.
5. Can of fuel. Can has tight stoppers and is painted red if used for gasoline.
6. Scale of 25-pound (12-kilogram) capacity sensitive to 0.01 pound (1 gram).
7. Piece of flat glass or pieces of bond paper with texture similar to the compaction forms.
Procedure
1. Weigh the pan to the nearest 0.01 pound (1 gram). Record the weight.
2. Place approximately 1 pound (0.5 kilograms) of representative sample of wet soil in the pan on the scale.
a. Record the combined weight.
3. Break up all lumps of soil with the putty knife or trowel and avoid any loss of the sample.
4. Place the pan with the sample in the oven with the stove on. Stir the soil every 3 to 5 minutes.
5. After the soil has changed to a lighter color and appears to be dry, remove the soil sample from the oven and test to determine if it is completely dry by using one of the following methods:
a. Lay a piece of bond paper approximately 2 × 3 inches (50 × 75 mm) on the sample.
i. If the paper curls immediately when laid on the sample, the soil contains moisture.
ii. The paper used for this test must be bond of hard surface texture like the paper used for the compaction forms.
b. Hold a piece of clean glass or a mirror in a horizontal position about 1 inch (25 mm) above the soil sample.
i. If the glass steams up, this is an indication of further moisture in the sample.
c. Keep the glass away from the heat of the stove or direct rays of hot sun prior to the test since this test depends upon condensation of moisture in the hot air onto the cooler glass.
6. If the test indicates further moisture is in the sample, stir the sample and continue drying.
a. Test the soil every 3 to 5 minutes until the test indicates the soil is dry.
7. Weigh the dried sample and pan to the nearest 0.01 pound (1 gram). Record this weight.
8. Subtract the weight of the pan from the weight of the pan and the dry sample to obtain the weight of the dried sample.
9. Subtract the weight of the dried sample from the weight of the wet sample. This is the weight of water in the original sample.
10. Divide the weight of the water by the weight of the dried sample. Multiply this result by 100. This gives the percentage of moisture in the sample. The equation is:
|
Percent Moisture = |
Weight of wet soil – Weight of dry soil |
× 100 |
|
Weight of dry soil |
Open-Pan Drying Method (1015.02.H.4)
This method is quick, simple, and obtains accurate results for granular material. This method should not be used for fine-grained soils (silts or clays) because the high temperatures may burn away the organic material if it happens to be present. This method can be used for fine-grained soils where limited accuracy is satisfactory and approximate moisture results are acceptable.
This method should not be used for any recycled material. It has been found to give lower moisture contents than is really in the material. This is particularly true for fly ash.
Equipment
1. Scale of 25 lb (12 kg) capacity sensitive of 0.01 lb (1 gram).
2. Several baking pans approximately 12 × 8.5 × 2.5 inches (300 × 200 × 63 mm).
3. Putty knife or other device for breaking up and stirring the soil.
4. Two-burner stove burning white gasoline.
5. Piece of flat glass or pieces of hard surface bond paper with texture similar to the compaction forms.
Procedure
Follow steps outlined in Section 1015.02.H.3 Oven-Drying Method Steps A thru L, except place the pan directly over the burner instead of in the oven.
Precautions
The following cautions should be taken to avoid introducing errors into the test.
1. Avoid overheating the soil.
a. Use two pans, one inside the other, to avoid hot spots that may occur when a single pan is used.
2. Avoid baking the soil.
a. Baking can be prevented by testing the material with a paper or glass test at sufficiently close intervals, so that further heating can be discontinued after all the moisture has been evaporated.
3. Ensure that no soil is lost during the test.
Alcohol-Burning Drying Method (1015.02.H.5)
This method is quick and simple. The alcohol burns at a low enough temperature 286º F to 320º F (140º C to 160º C) so that it can be used with accuracy for most soil types.
This method should be done outside or in a well-ventilated area.
Equipment
1. Scale of 25 lb (12 kg) capacity sensitive of 0.01 lb (1 gram).
2. 12 × 8.5 × 2.5 inches (300 × 200 × 63 mm) baking pan.
3. Pan or can with perforated bottom and filter paper to fit bottom.
a. A 10 oz (300 mL) round sample can is suitable for this purpose.
4. Glass stirring rod.
5. Supply of alcohol in tightly sealed can.
Procedure
1. Weigh perforated pan or can with filter paper in the bottom. Record weight.
2. Place sample of wet soil in perforated pan or can; weigh and record weight.
3. Place perforated pan or can in larger pan and stir alcohol into the soil sample with a glass rod until the mixture has the consistency of a thin mud or slurry.
a. When stirring, do not disturb the filter paper on the bottom.
b. Clean the rod.
4. Ignite the alcohol in the other pan and in the sample and burn off all alcohol.
5. Repeat the process three times, or until successive weighings indicate no reduction in weight, after each time burning.
6. After final burning, weigh perforated can or pan and dry soil, and record weight.
7. The weight of dry soil equals the weight minus weight of perforated pan or can and filter.
8. Calculate moisture content as shown in Section J though L of Section 1015.02.H.3.
Gasoline-Burning Drying Method (1015.02.H.6)
Application
This is a quick and simple method of drying. However, the gasoline burns at such a high temperature that it should be used only to dry granular materials. This method should only be conducted outside.
Equipment and Procedures
This method of drying is similar to the alcohol-drying method with the exception that the perforated pan and filter are not used. The gasoline can be mixed with the sample in the baking pan and burned in the pan. Except for this, the test is run exactly the same as the alcohol-burning method, described in Section 1015.02.H.5.
Compaction Testing Requiring an Aggregate Correction (1015.03)
The Aggregate Correction Problem (1015.03.A)
As detailed in Section 1015.01.E.3 “Coarse Aggregate Problem” the moisture-density relationship is very good for soils passing the ¾ inch (19 mm) sieve as it relates to the field compaction of soils. There are problems when this relationship is extrapolated to soils larger than the ¾ inch (19 mm) sieve material or for granular soils. Corrections must be made to account for these materials. In certain circumstances, field densities do not correspond to the laboratory results.
Figure 1015.03.A details a plot of adding or subtracting coarse aggregate to a soil and the resulting change in the moisture-density curves.
As you add gravel or plus ¾ inch (19 mm) material to the soil, the optimum moisture shifts to the left and the maximum density increases. The average increase in density is approximately about 1 percent per 10 percent of material retained on the ¾ inch (19 mm) sieve.

Figure 1015.03.A - Coarse Aggregate Effects
If you sieve the material through the ¾ inch sieve, remove 20 percent coarse aggregate, and do not consider this, you could easily be one or two curves lower than intended.
This correction usually increases the maximum density and an optimum moisture correction is made. This effect is taken care of on the compaction form CA-EW-6.
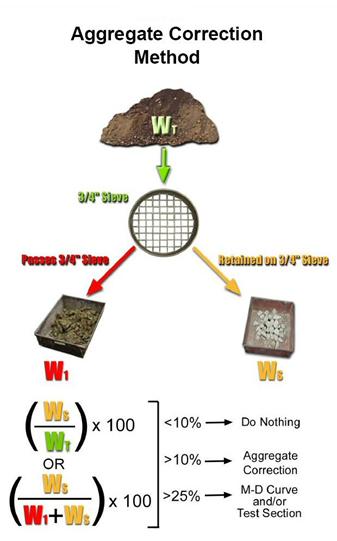
Use the correction on the CA-EW-6 compaction form where more than 10 percent but less than 25 percent of the material is retained on the ¾ inch (19 mm) sieve. See Figure 1015.03.B, Aggregate Correction Method.
Figure 1015.03.B - Aggregate Correction Method
Caution: An, ‘almost’ pure sand may have between 10 and 25 percent retained on the ¾ inch sieve. A test section method would be used in this case. This method is to be used with ‘Fine Grained Materials’ with significant granular material retained not granular materials.
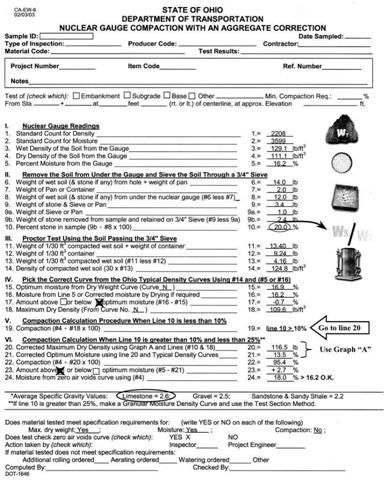
Using Form CA-EW-6 Nuclear Gauge Compaction with an Aggregate Correction (1015.03.B)
A completed Form is detailed in Figure 1015.03.C. The general sections of this form are as follows:
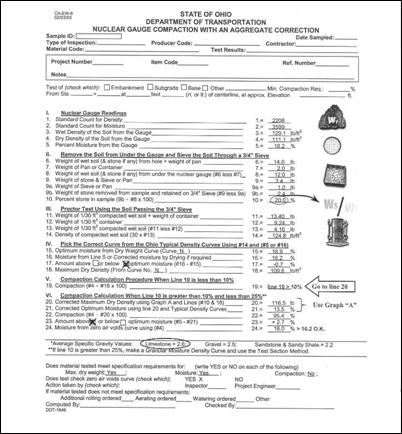
Figure 1015.03.C - Completed CA-EW-6 Compaction Form (pictures added for clarity)
I. Nuclear Gauge Readings
Lines 1 thru 5 are explained in Section 1015.02.D.
II. Remove the Soil from under the Gauge and Sieve thru a ¾ inch Sieve
This section is straightforward calculation of the stone retained on the ¾ inch sieve. Calculate through lines 6 through 10.
The percentage on line 10 is represented by the following equation:
|
Percent of Stone in Sample = |
Weight of stone retained |
× 100 |
|
Weight of total soil sample |
III. Proctor Test Using the Soil passing the ¾ inch Sieve
See Sections 1015.02.F section ‘D’ & 1015.01.B.2 for an explanation of Lines 11 thru 14.
IV. Pick the Curve for the Ohio Density Curves Using # 14 and (#5 or 16)
See Section 1015.02.F for an explanation of Lines 15 through 18.
V. Compaction Calculation When Line 10 is less than 10%
Line 19 is explained in Section 1015.02.G.
VI. Compaction Calculation When Line 10 is greater than 10% and less than 25%
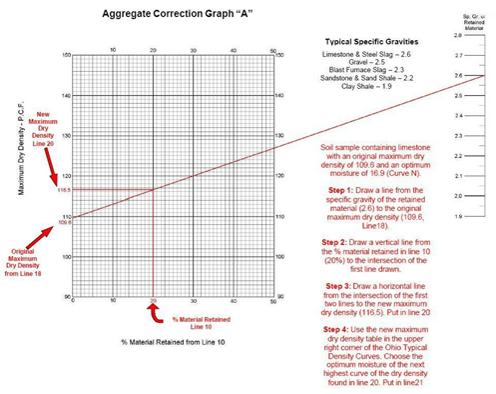
This section uses Figure 1015.03.D Aggregate Correction Graph A and Figure 1015.03.E Moisture Correction with an Aggregate Correction to find a new Maximum Dry Density and Optimum Moisture.
The Nuclear Gauge Testing is almost the same as detailed in Section 1015.02 with the exceptions being the calculation of the Percent retained on the ¾ inch sieve in on line 10 in Section II and Section VI is new.
Calculate a New Maximum Dry Density
This section details Figure 1015.03.D Aggregate Correction Graph A:
The instructions are on the graph.
1. The inputs needed are:
a. The Specific Gravity of the Stone Retained on the ¾” sieve.
i. The typical values are listed on the graph.
b. The Maximum Density Found on Line 18: 109.6 lb/ft3
c. The Percent retained on the ¾ inch sieve on Line 10: 20%
2. Draw a line between the specific gravity and the Line 18 value.
3. Input Line 10 value on the bottom of the graph and draw a vertical to the previously line drawn.
4. Continue the line to the left on a right angle to the Corrected Maximum Dry Density.
5. Input this value found on line 20 on the CA-EW-6.
This is the corrected Maximum Dry Density: 116.5 lb/ft3
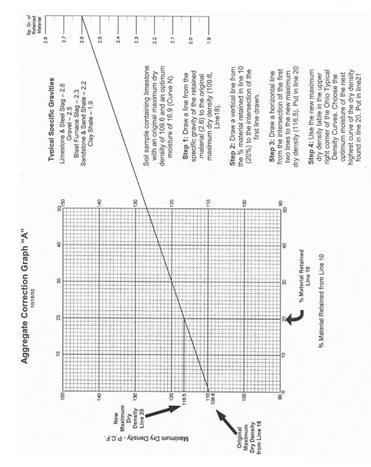
Figure 1015.03.D - Aggregate Correction Graph A
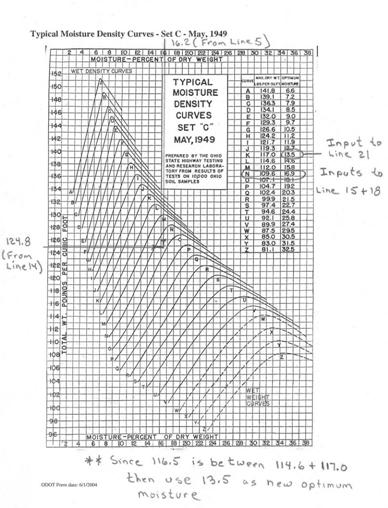
Determine a New Optimum Moisture
New optimum moisture is found by inputting the New Maximum Dry Density into the maximum Density Values in the upper right hand corner on Figure 1015.03.E.

Figure 1015.03.E - Moisture Correction for an Aggregate Correction
For Example, the Maximum Dry Density on Line 20 is 116.5 lbs/ft3. This value is between curve K (117) and L (114.5). New optimum value is 13.5% which is the moisture corresponding to the next highest curve which is Curve K.
Compaction, Difference in Optimum Moisture and Zero Air Voids
The compaction, difference in optimum moisture, and the zero air voids are calculated on lines 22 to 24. The calculation is the same as before.
Figure 1015.03.F - Zero Air Voids curve
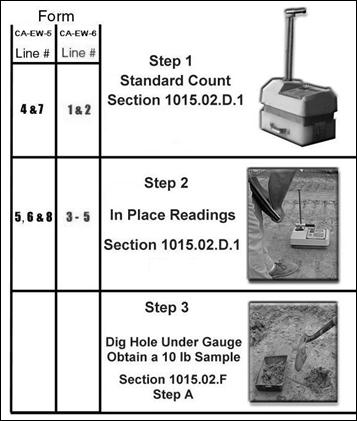
Figure 1015.03.G - Outline for Using Forms CA-EW-5 and CA-EW-6 (1 of 2)
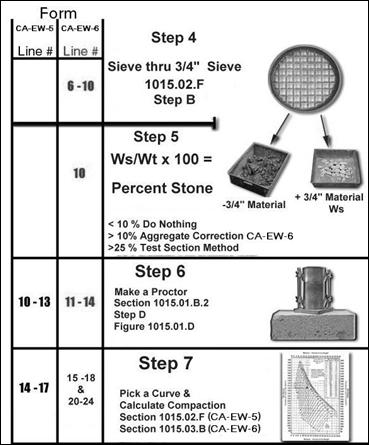
Figure 1015.03.H - Outline for Using Forms CA-EW-5 and CA-EW-6 (2 of 2)
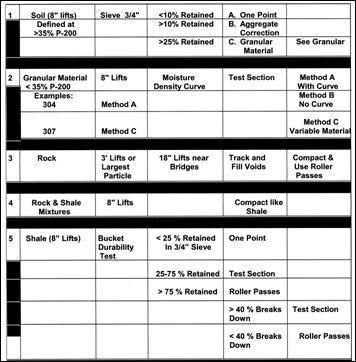
Figure 1015.03.I - Compaction and Testing Guide
Compaction Testing for Granular Materials (1015.04)
General Explanation (1015.04.A)
This section describes how to perform compaction testing for materials used as granular soil, sand, structural backfill type 1 or 2, 304, 411, select granular backfill for MSE walls, granular material type A, B, C, D or F, or any materials that requires a test section.
The dry weight of the material is used for compaction control. The wet weight method is no longer used.
Moisture-Density proctor curves were originally developed for use on cohesive (clays and silts) soils. Errors or complications arise when trying to extrapolate these principles to other materials. This is the reason the Engineer or Inspector is given the latitude to choose density requirements that are based on the test section results.
A one-point proctor method using the typical density curves may be used for granular soils. The top curves of the Ohio Typical Density Curves A through E are usually chosen in this case. These curves will only work in a very limited number of cases. This method should only be used as a last resort.
These materials must have a moisture-density curve made a few weeks before the Contractor proposes to use the material. Curves may be made in the field or by the Laboratory.
Making a moisture-density curve for these materials is the same procedure explained in Section 1015.01.B. A typical moisture-density curve for a granular material is shown in Figure 1015.04.A.
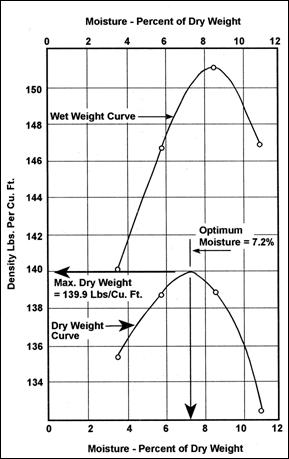
Figure 1015.04.A - Typical Granular Moisture-Density Curve
The district should contact the Office of Geotechnical Engineering at the following link to have a moisture-density curve made:
www.dot.state.oh.us/Divisions/ProdMgt/Geotechnical
The maximum density and optimum moisture data obtained from this curve may or may not work in the field. The following are examples and further explanation of some of the problems associated with the density control of these materials.
Examples of Density Problems (1015.04.B)
Using a Sandy Material (1015.04.B.1)
It may not be possible to obtain the maximum density of the curve no matter how or with what equipment the Contractor uses to compact the material. This is particularly true for sandy material with silt fines.
Reason
The proctor mold used to produce the moisture-density curve confines the sand in all directions. In the field, since sand doesn't interlock or knit together well without being confined, the roller will squeeze the material laterally. The proctor maximum densities may not be obtained in the field.
The sand may not even support the weight of the roller. The lab and field confining pressures and compactive effort are not compatible in this case.
This is shown in Figure 1015.04.B
Solution
Use the test section maximum density.
1015.04.B.2 Using a Well Graded Granular Material like 304
In this case, the maximum dry densities obtained in the field using the test section method often exceed the maximum dry density of the moisture-density curve.
Reason
The 304-type material is well interlocked and allows the roller to transfer more energy, compactive effort, or load to the material.
This roller load or energy is much larger than the proctor hammer load of 5.5 lbs. (2.5 kg) dropped 12 inches (305 mm) in three lifts.
This is shown in Figure 1015.04.B
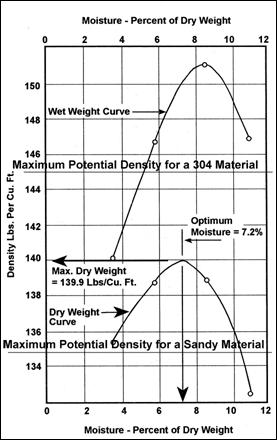
Figure 1015.04.B - Maximum Density Problems
Solution
Use the test section maximum density.
Compacting on a Soft Foundation (1015.04.B.3)
If the material is being compacted on a soft foundation, then the maximum density cannot be achieved. Excessive rolling will only result in pumping and creating an unstable foundation.
This applies to all types of materials. You cannot compact good material over bad material and expect to achieve a maximum density. You cannot compact material on jello-type material to a maximum density either. The maximum test section densities, if taken at all, would be less than the maximum curve value.
Compacting in Confined Spaces (1015.04.B.4)
There are a variety of locations where light equipment is used to compact material. Some examples are for:
1. Pipe backfill.
2. Manhole backfill.
3. Around abutments.
4. MSE walls.
The potential maximum density is limited to the type of equipment used to compact this material in these confined spaces.
Throughout the specifications for these items, ODOT requires minimum compaction equipment weight for these areas where a test section is used for compaction acceptance.
The maximum density that can be achieved is proportional to the heaviest equipment that can be used in these locations. The maximum density that can be achieved in these locations is usually less than the moisture-density curve value.
Moisture Problems (1015.04.C)
The granular material should be brought on site at or near optimum moisture. When this is not the case, moisture should be added before rolling occurs. This is particularly important for 304 gradation materials since this material cannot readily absorb water.
In 304.03, it is required that the stockpile of 304 material have a moisture content of at least 2 percent below optimum.
Optimum moisture from the proctor moisture-density curve of granular materials is not always correct. Sometimes the granular material begins to roll or pump when the material is compacted at or near optimum moisture obtained from the moisture-density curve. This is caused by excess water in the material and the difference between the field and curve confining forces. In this case, dry the material until stability is achieved; usually 1 to 3 percent below optimum will work.
Summary of the Moisture-Density Problems (1015.04.D)
A granular moisture-density curve should always be used to estimate the maximum density and optimum moisture. When using these materials, the proctor moisture-density curve is used as a guide; the exact maximum density and optimum moisture can only be found in the field.
The test section method of compaction acceptance compensates for:
1. Material Differences.
2. Moisture-Density Curve and Potential Field Density Differences.
3. Moisture Problems.
4. Soft Foundations.
5. Confined Construction.
The maximum density determined in the field is relative to all of the above.
Equipment and Compaction Testing (1015.04.E)
The equipment used for compaction testing is the same equipment listed in 1015.02.B.
The compaction testing is the same as in section 1015.02.D, except for the following:
1. A proctor is not taken for every test.
a. Only used to obtain the moisture-density curve.
2. The ‘Backscatter Mode’ on the gauge is used.
a. Ensure that the surface voids are all filled or the surface texture is the same.
b. Variation in the measurements will result.
3. Use Form CA-EW-5.
Minimum Roller Weights for Test Sections (1015.04.F)
Throughout the specifications, you will find minimum roller weight requirements when a test section method is used for acceptance.
The following is from C&MS 203.06.A, page 92.
“For soil or granular material, when a test section is used, use a minimum compactive effort of eight passes with a steel wheel roller having a minimum weight of 10 tons (9 metric tons).”
The following is from C&MS 603.11.E, page 440.
“At the beginning of the work, construct a test section in the conduit trench. The Engineer will use at least 96 percent of the test section maximum dry density for acceptance of the production areas. Use at least the same number of passes or compactive effort used to construct the test section to compact the production areas. Use compaction equipment with a total weight or centrifugal force of at least 1/2 ton (0.5 metric tons). Supply the manufacture’s specification for the compaction equipment. Except when using a hoe pack, use at least six passes with the compaction equipment in the production areas.”
The maximum potential obtained in the field is relative to the roller weight used in the test section. Therefore, minimums were established to fit the field conditions. You will notice that the confined areas have a much lower minimum weight and less maximum acceptance value.
Do not be confused by the word centrifugal force. It is only the effective weight when including the vibration of the equipment.
Procedure for Constructing a Test Section Method A (1015.05)
Method A is used when the moisture-density curve can be established to estimate the maximum density and optimum moisture.
The following is an outline of the procedure:
1. Test section size is 400 square yards.
2. Spread the material at the correct lift thickness.
a. Usually 6 to 8 inches.
3. Moisture content at - 2 to + 2 of optimum.
a. Water or dry throughout the lift.
b. Reduce moisture if unstable.
4. Compact with two passes.
5. Take a compaction test.
a. Mark the location with paint.
b. Record on Line 6 of Form CA-EW-5.
6. Compact with one more pass and continue testing until:
a. No further increase in density.
b. Or the density decreases.
7. Once a maximum is obtained.
a. Make two additional passes and take one additional test.
b. Verifies the maximum value.(Verification Test).
8. Record the total number of passes.
a. Use Line 9 of CA-EW-5.
9. Use this number of passes or the specification minimum in the production area.
10. Compact the production area to at least 98% of the test section maximum.
There are statements throughout the specifications that require a minimum number of passes. Experience has shown that these minimum passes for the different materials result in more uniform compaction in the production areas.
If the specification calls for 8 passes, use the 8 passes even though the test section may show that 6 passes are needed to obtain a maximum. More production area tests will pass by using these minimum passes.
There are also statements throughout the specifications that allow a decrease in minimum number of passes such as:
“The Engineer may reduce the minimum passes if the passes are detrimental to compaction”.
There are also statements about making a new test section when conditions change.
“Construct a new test section if the pipe type, bedding material, backfill material, or trench conditions change.”
All of these statements allow the Engineer to control the work to meet the field conditions and to obtain maximum densities.
Test Section Value Examples (‘X’ denotes Maximum Used)
|
Passes |
2 |
3 |
4 |
5 |
6 |
Verification Passes (2) |
|
Density |
126 |
134 |
135 |
140X |
122 |
125 |
|
|
110 |
108 |
112 |
116 |
116X |
109 |
|
|
120 |
129 |
132 |
130 |
|
145 (Take more Tests) |
Test Section Method B (1015.06)
This type of test section is used when a moisture-density curve cannot be made or is not available at the time of construction. Recycled materials such as some foundry sands or fly ash can be tested this way. Since the maximum density or optimum moisture are unknown, we have to create the field curve.
Use the same procedure as in Section 1015.05 except for the following.
1. Place the material in the required lifts.
a. Bone dry (0 to 3%).
2. Compact and test until:
a. A maximum value is reached.
b. Record the density on Line 6 on the CA-EW-5.
c. Record the number of passes on line 9.
3. Place new material.
a. At a new location.
b. At a moisture content 2% higher.
4. Compact and test to a maximum value.
5. Repeat the procedure.
a. At higher moisture until.
i. Maximum value is achieved.
ii. Two test sections have the same or lower densities.
iii. Material becomes unstable.
6. Use this maximum density, optimum moisture and number of passes in the production areas.
Figure 1015.06.A - Typical Fly Ash Curves
Test Section Method C (1015.07)
This test section is used for open graded material such as non-stabilized drainage base. It also can be used for open graded aggregate bases where the surface texture is very open and or non-uniform.
The test section procedure is the same as detailed in 1015.05 except for the following:
1. Use the CA-EW-7 compaction form.
2. Place the material at 3% above saturated surface dry (SSD).
3. Compact at 1.5% above SSD.
4. Construct a Test Section.
a. 400 square yards.
b. Take 3 tests.
c. Then average them.
d. Compare the averages.
e. See Section 2 of the CA-EW-7 Form.
5. The maximum is reached when:
a. A maximum density average is achieved.
b. Or the aggregate breaks.
c. Whichever is first.
6. Take 10 tests in the control section.
a. See Section 3 on the CA-EW-7.
b. Use 95% of this density as the control section maximum.
7. For acceptance.
a. Take 5 tests in a 5000 square yard lot.
b. This average must be greater than 95% of the control section maximum.
Compaction Testing for Shale (1015.08)
Compaction testing for shale will depend on the durability of the shale. Perform the durability test (“bucket test”) outlined in Section 203.02.P under Shale Identification (703.16.D). The compaction testing is directly associated with the results. It provides a ready means to determine what test method to use for compaction acceptance. The following is a summary:
1. If less than 25% of the shale is retained on the ¾ inch (19 mm) sieve.
a. Then test and break down like soil.
b. Use the one-point proctor method.
2. If 25 to 75% of the shale is retained on the ¾ inch (19 mm) sieve.
a. Break down to granular material size.
b. Test for compaction test using the test section method.
3. When greater than 75% of the shale is retained on ¾ inch (19 mm) sieve, use roller method in 703.16.D.4 for durability.
a. If more than 40% breaks down.
i. Break down to granular size.
ii. Use the test section method.
b. If less than 40% breaks down.
i. Hard Durable Shale.
ii. Use roller passes in 203.06.
iii. No testing is required.
In practice, different materials will always be mixed together in a fill situation. However, this hardness or durability test gives a good indication of how the material should break down during compaction, and is an excellent means to determine compaction acceptance.
Compaction Acceptance (1015.09)
This section divides up the work into lots. It allows the project to accept material based on a lot size. The lot size is denoted in section 1015.10.
Minimum Number of Tests (1015.10)
Use Forms CA-EW-5, CA-EW-6 and CA-EW-7 for recording and reporting results of compaction tests. Retain these tests in the project files. Keep these tests in the folders of the items of work.
This section outlines the lot size and number of tests that are used on each lot for acceptance.
Under normal field conditions, the number of density and moisture checks required should not be great after the initial period of adjustment, assuming that the work is proceeding smoothly and materials being compacted are uniform.
The Engineer and inspector will learn to judge the moisture content of the material quickly by appearance and feel. If adequate densities are being obtained and the proper moisture content is being maintained, the job of inspection may then become one of deciding on the number of passes of the roller required for satisfactory test section density and seeing that this number of passes is actually made.
Under such conditions, only one or two density checks per day may be required. Where conditions are more variable, density and moisture checks may be needed as often as once an hour. The Engineer and Inspector can determine the exact number of checks required.
Sample problems for forms CA-EW-5 and CA‑EW-6
Compaction and Testing Guide
Page 1 of the Compaction Testing Outline
Page 2 of the Compaction Testing Outline
Ohio Typical Density Curves
Filled Out CA-EW-5
Ohio Typical Density Curves for the CA-EW-5 Example
Blank CA-EW-5
Zero Air Voids Curve for the CA-EW-5 Example
Aggregate Correction Method
CA-EW-6 Example
Aggregate Correction Graph A
Ohio Typical Density Curve for CA-EW-5 Example
Blank CA-EW-6
Documentation Requirements - Supplement 1015 Compaction Testing of Unbound Materials
1. Document all materials, inspection and compaction information on Form CA‑EW‑12.
2. For Items 203, 204, 205, 206, 840, 503, 603 Soil Embankment and all Items where 203 Embankment is specified
a. If less than 10 percent of material passes the ¾ inch sieve, document on form CA-EW-5
b. If more than 10 percent but less than 25 percent of the material passes the ¾ inch sieve, document on form CA-EW-6
c. If more than 25 percent of the material passes the ¾ inch sieve, document on form CA-EW-5
3. Items 203 Granular Embankment, 203 Granular Material Types A, B, C, D or F, Item 304, 411, 503, Select Granular Backfill for MSE walls and 603 Structural Backfill and Granular Embankment, document on form CA-EW-5
4. Non-stabilized drainage base, Document on CA-EW-7