203 Roadway
Excavation and Embankment
Introduction
After many years of solving
soil and rock problems throughout the state, the author of this section can
assure the reader of ‘One Constant.’
“Soil
and Rock Conditions Vary, Vary and will Vary Again.”
The author could repeat this
statement a hundred times throughout this manual and it would be a hundred
times too few.
Earthwork consists of roadway
excavations (cuts) and roadway embankments (fills) for highways and associated
items of work. Earthwork includes all
types of materials excavated and placed in embankment, including soil, granular
material, rock, shale, and random material.
Associated items of work, include preparation of foundations for
embankment, disposal of excavated material, borrow, preparation of the
subgrade, proof rolling, rock blasting, base construction, and berm aggregate
construction.
If pavement is to remain
smooth and stable during years of service under traffic, the earthwork on which
it is built must be stable and must furnish uniform support. Where roughness, settlements, and other
distress develop in pavement during service under traffic, the cause often is a
deficiency in the stability of earthwork that supports the pavement.
Uniformity of earthwork is
necessary and important to obtain high stability and long-term performance at
all locations throughout the length and width of the project. Consider, for example, a highway project
where 95 percent of the earthwork was performed according to the
specifications, but five percent was non-specification and low-stability
material, which appeared in many small areas throughout the project. Pavement roughness and distress developed in
these areas during service under traffic loading. Such a project would be evaluated by the traveling
public as a rough job or a poorly constructed project. No notice or credit would be given to 95
percent of the work that was constructed properly. The entire project might be discredited and
be considered poor because a small proportion of the project was constructed
with poor earthwork construction procedures or practices.
The foregoing example is
intended to illustrate the need for consistent compliance with earthwork
specifications in all areas, both large and small, throughout the length of the
project, and from the beginning to the end of earthwork construction.
Importance of Proper Embankment Construction
The embankments that ODOT
constructs are structures. The success of these structures is directly
proportional to the project’s emphasis on correct embankment techniques.
The importance of proper
construction practices cannot be overemphasized. The results of improper construction
practices may or may not show up during construction. However, improper practices will eventually
become evident at some point during the life of the embankment structure.
The construction requirements
in the specifications are written to maximize the embankment structure’s
life. When the specifications are not
followed, the life expectancy will decrease, and the future maintenance cost
will increase.
The embankment structure is
shown in Figure 203.A. The structure
consists of three main components:
- Foundation.
- Embankment.
- Pavement.
A geotechnical engineer
ensures that the embankment will be stable as designed. The pavement is constructed on top of the
embankment.
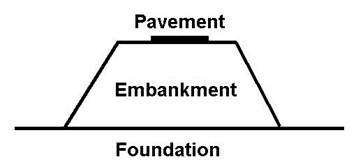
Figure
203.A – Embankment Structure
The embankment that is shown
in the plans structurally bridges the foundation and supports the
pavement. The embankment is built by
compacting layers of materials in horizontal lifts, as shown in Figure
203.B. These lifts consist of soil,
granular material, rock, shale, asphalt, concrete, or recycled materials. The embankment’s resistance to movement
relies on the proper construction of these lifts. These lifts work together as
a unit to resist the loads.
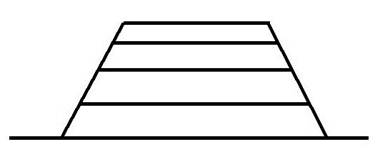
Figure
203.B – Embankment Layers
A condition, such as the one
in Figure 203.C, can occur if an embankment is not properly constructed. When this condition occurs, the factor of
safety is less than 1.0 and the embankment fails.
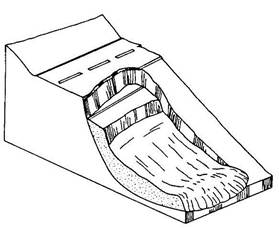
Figure
203.C – Embankment Failure
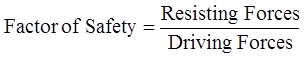
A factor of safety is the
ratio of the resisting forces divided by the driving forces, as shown in the
following equation.
Typically the minimum factors
of safety for embankment structures are from 1.3 to 1.5. Figure 203.D illustrates the resisting and
driving forces. The weight of the fill
works to move the foundation and the embankment counter clockwise to the
right. The internal strength of the
embankment layers and the foundation work together to support the
pavement. Failure may occur in a
circular fashion as shown, in a semi-circle, in a block mode, or wedge. The basic principles are the same in all
three modes of failure.
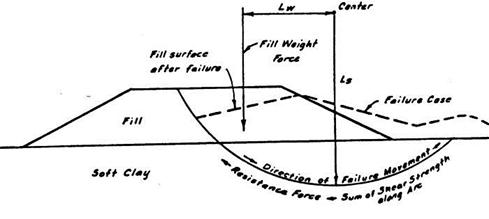
Figure
203.D – Resisting and Driving Forces for Embankment Failure
Importance of Proper Excavation
Proper excavation techniques
in cut sections are just as important as embankment construction. The only
difference is that when it fails, the rock or soil falls onto the roadway
instead of the roadway failing.
This is illustrated in
Figures 203.E-1 and 203.E-2. If a soil
cut is cut too steep, then the soil can flow onto the roadway as illustrated in
203.E-1. This figure shows a deep-seated
wedge failure. This failure can also occur
in an embankment condition.
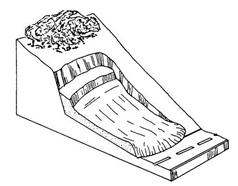
Figure
203.E-1 – Cut Slope Failure (deep seated wedge)
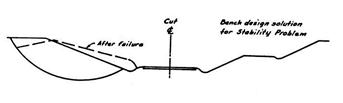
Figure
203.E-2 – Cut Slope Failure (rotational failed condition)
Figure 203.E-2 details a
rotational failed condition on the left.
The right side shows a design that is properly benching so that it
reduces the driving forces. If a rock
cut is cut too steep, the rock can fall onto the roadway.
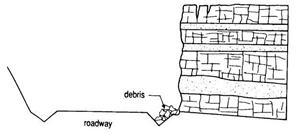
Figure
203.F – Falling Debris from Vertical or Nearly Vertical Faces near Roadway
The above rock and soil
conditions can be avoided during the design or construction of a project. Ensure that the plan intent is followed in
these cut locations on the project. Rock
and shale excavations will be detailed under Section 208 Rock Blasting.
Materials (203.02)
In the 2002 version of the
specification, the definitions and material requirements were changed for the
different types of material allowed under the specifications.
In order to properly detail
the requirements, it was necessary to divide up natural and recycled material
requirements. Too many times in the past
Contractors would try to obtain approval for materials that were not intended
under the specifications.
A natural material is a
material that was created by nature; a material that is mined or excavated and
graded is a natural material. A material
that is chemically altered by a manufacturing process such as concrete, fly
ash, foundry sand, or slag is a recycled material.
Materials are defined in 203.02.
All of the allowed materials are detailed in 203.02.R
as “Suitable Materials.” Specific, more
detailed material requirements are located in 703.16.
In the following sections the
materials will be detailed in the specific 203.02
sections for clarity.
If there is any doubt on the
condition, status, acceptability, or approval of the materials throughout the
following sections, then the project should contact one of the following: the District Engineer of Tests, the District
Geotechnical Engineer, the Aggregate Section of the Office of Materials
Management, or the Office of Geotechnical Engineering.
Natural Soil
(203.02.I)
The definition for natural
materials in 203.02.I
is as follows: “All natural earth materials, organic or inorganic,
resulting from natural processes such as weathering, decay, and chemical
action.”
Allowable materials are
materials such as clay, silt, sand, or gravel.
These are allowed as suitable materials and are further defined in 703.16.A.
Department Group
Classifications A-4-a, A-4-b, A-6-a, A-6-b, and A-7-6 are allowed. All of these
materials are fine grained and have more than 35 percent of the particles
passing the No. 200 sieve. More detail
can be found by examining Figure 203.G. These classifications are further
defined on the right side of the chart under Silt-Clay Materials.
Materials must have a maximum
dry density of at least 90 pounds per cubic foot (1450 kg/m3). Materials that are less than this density
usually have too much organic matter or clay materials.
Soils that have a liquid
limit in excess of 65 or identified as Department Group Classifications A-5, or
A-7-5 are not allowed. The A-5 material
is highly elastic by virtue of its high liquid limit. The A-7-5 material is
highly elastic and subject to volume change.
Natural Granular
Materials (203.02.H)
These materials are defined
in 203.02.H
as follows: “Natural granular materials include broken or crushed rock, gravel,
sand, durable siltstone, and durable sandstone that can be placed in an 8 inch
(200 mm) loose lift.”
These materials are allowed
in 203.02.R,
Suitable Materials. The material requirements are further detailed in 703.16.B
and 703.16.C.
Under 703.16.B,
Department Group Classifications A-1-a, A-1-b, A-3, A-3-a, A-2-4, A-2-6, or
A-2-7 are allowed. All of these
materials generally are mixtures of coarse and fine grained materials. These materials have less than 35 percent of
the particles passing the No. 200 sieve.
More detail can be found by examining Figure 203.G. These
classifications are further defined on the left side of the chart under
Granular Materials.
Granular material classified
as A-2-5 is not allowed because of its low weight, high optimum moisture, high
LL, low PI, and its propensity to slough.
Section 703.16.C
allows durable sandstone and durable siltstone.
If these materials meet the slake durability requirements in ASTM D 4644, then the
material is considered equivalent in strength and durability to other natural
granular materials.
Section 703.16.C
allows slags and recycled Portland cement concrete to be used as granular
material types.
Contact the Office of
Geotechnical Engineering to arrange for the appropriate materials testing if
sandstone or siltstone is used for this application.
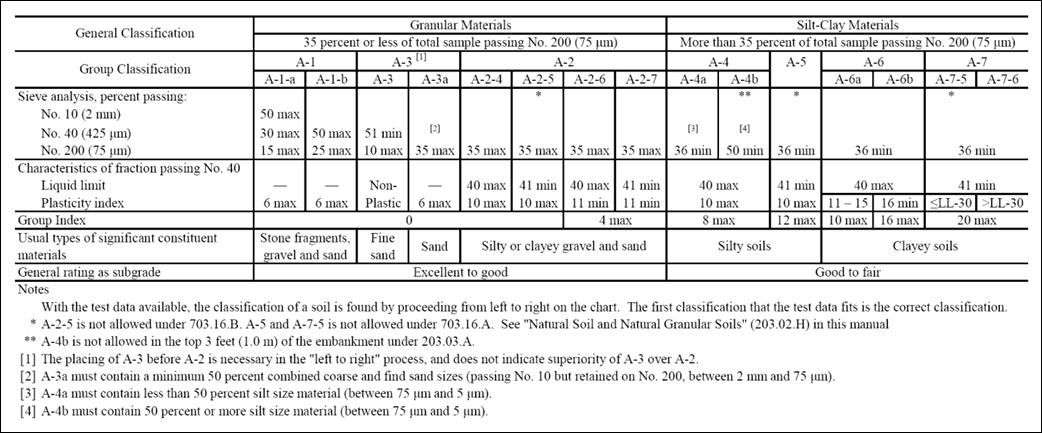
Figure 203.G – Department Soils Classification Chart
Identifying Soil and
Granular Materials in the Field
It is sometimes necessary to
make field decisions based on very little (if any) laboratory soils
information. It may be necessary to
verify the accuracy of plan soil borings in the field. In these two cases, and on other occasions,
it is important to have a basic understanding of how to identify types of soils
and granular materials in the field. The
following are some, but certainly not all, of the methods that can be used to
identify these materials in the field.
Granular Soils
Granular soils are easily
identified by their particle size in the field.
A sample may be taken inside and spread on a table to dry. A rough estimate of the material retained or
passing each sieve may be obtained by examining the material when dry. Finer
materials such as clays and silts cannot be separated and can only be
distinguished between one another by a settling technique. This can be accomplished by using a
hydrometer or by performing a crude settling test. This technique is beyond the scope of this
manual.
Fine Grained Soils
(Clays and Silts)
It is more important, yet
harder to distinguish between a clay and silt material in the field. Clays and silts should be treated and used
differently in the field because of their difference in engineering and compaction
properties. Refer to properties of soils
in the next section.
A clay material can be easily
rolled into a thread at a moisture content near, or above, the plastic limit of
the material. Clays can often be rolled
into 1/8 inch (3 mm) diameter threads (about half the diameter of a
pencil). See the plastic limit test
later in this manual for further information.
As the clay content increases, the thread may be easier to roll into
smaller sizes. No matter what the soil
content is you cannot roll a pure silt material into a 1/4 inch (6 mm) thread.
Clay forms hard pieces that
cannot be broken by hand pressure when it is dry. Place an irregular piece of dry soil between
the index finger and the thumb, and try to break the material. If the material is difficult or impossible to
break, it is probably clay. A silt or
sandy material will generally break easily with this amount of hand pressure.
Clay fines are generally
greasy, soapy, and sticky. Wet clay
dries much slower than silt.
When performing these hand
techniques, observe the soil residue found on your hands for further
information. If the soil on your hands
is difficult to remove, and the hands need to be rubbed briskly together to
remove the soil, the material is probably clay.
A silt material is easily removed when hands are rubbed together.
A silt material will react to
vibration or shaking. Place a small
amount of pliable soil in your hand.
Hold the material in one hand and drop that hand on the other hand or a
hard surface. Water will form on the
surface of a silt material. You can also
put the soil in a bowl and tap it on a table to get the same result. Clay will not react to this test.
The aforementioned
identification techniques should not replace classification by the laboratory,
but should be used as a supplement.
If there is any concern, send
a sample to the District Engineer of Tests for further classification.
Engineering
Properties of Soil and Granular Materials
The following are general
statements regarding the engineering properties of soil and granular
materials. Consider these properties
when solving field problems.
Properties of
Granular Soils
- Good foundation and embankment
material.
- Not frost susceptible, if free
draining.
- May erode on embankment side
slopes.
- Identified by the particle size.
- Easily compacted when well
graded.
Properties of Fine
Grained Soils
- Often have low strengths.
- Plastic and compressible.
- Lose part of their shear
strength when wet or if disturbed.
- Practically impervious.
- Slopes are prone to slides.
Properties of Silts
- High capillary action and frost
susceptible.
- No cohesion and non-plastic when
pure silt.
- Highly erodible.
- Difficult to compact.
- Release water readily when
vibrated.
- Acts like an extremely fine sand
during compaction.
Properties of Clay
as They Relate to Silt
- Better load-carrying qualities.
- Less permeable than silt.
- Easier to compact than silt.
(Any soil is easier to compact than silt.)
- More volume change potential.
- Plastic or putty-like property.
- Clays are weaker when compacted
wet of optimum.
Moisture Effects on
Soils
Granular soils are less
affected by moisture content than clays and silts; have larger voids; and are
free draining. Granular materials have
relatively larger particles than silts and clays.
Moisture content (also called
water content) has a large effect on the physical properties of fine-grained
soils. The Atterberg
Limits are used to describe the effect of varying moisture contents on the
consistency of fine-grained soils. See
Figure 203.H.
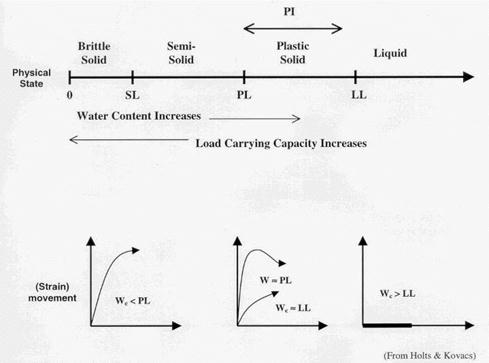
Figure
203.H – Atterberg Limits
The plasticity index (PI) is
used to classify soils. The plasticity index
is calculated by subtracting the plastic limit (PL) from the liquid limit (LL)
(e.g. PI = LL – PL). The liquid limit
and plastic limit are the moisture contents at the condition of the test.
Liquid Limit
- Transition between the
plastic solid and liquid state.
- At liquid limit of 100
the soil contains equal weights of soil and water (i.e., Wc = Ww/Ws
= 50/50).
- At liquid limit of 50,
the soil is 2/3 soil and 1/3 water (example Wc =
33/66).
- High liquid limit
indicates soils of high clay content and low load carrying capacity.
Plastic Limit
- Transition between
semi-solid and the plastic solid.
- The soil condition,
when it contains just enough moisture to be rolled into a 1/8-inch
diameter thread without breaking, just starts to break-up.
- Governed by the clay
content.
- The greater the clay
content, the higher the plasticity (PI = LL – PL) and cohesiveness.
- Load carrying capacity
increases rapidly as the moisture content decreases below the plastic
limit.
The following is a brief
description of the characteristics of soils in the physical states.
Liquid Soil State
Characteristics
- Highly saturated
state.
- Flows under its own
weight.
- Very little or no
friction between the particles.
Plastic State
Characteristic
- Soil can be remolded
into various shapes.
- Like modeling clay.
Semi-Solid Soil
State Characteristics
- No longer pliable.
- Sample will crumble
when rolled.
Brittle Solid Soil
Characteristics
- Soil ceases to change
volume due to the loss of water.
- No real engineering
application.
Detailed Soil
Property Explanation
Each term used in
geotechnical engineering has specific meaning and application. Each soil test has specific meaning and
application and indicates certain soil properties. Using correct terminology will prevent
confusion and misunderstanding.
Soil
Soils have properties that
influence their behavior and value. The
properties of soil will vary with gradation (composition), moisture content,
vertical position in relation to the surface of the ground, and geographical
location. The more common properties
encountered and used in highway work are defined and discussed in Section 203.
Most soils were originally
solid rock. Time and climate have broken the rock into progressively smaller
particles. This can be shown in the
laboratory by taking two or three pieces of gravel or stone and pulverizing
them. First, sand-sized particles can be
made, then silt-sized particles, and finally clay-sized particles. Chemical
changes take place as nature reduces rock into finer particles; therefore, clay
produced by nature over a period of many years will vary from clay-sized
material produced in a short time in a laboratory.
Particle Size
By naming and defining the
size of soil particles, all soil tests are placed on a common ground for
comparison. The amount of soil retained
or passing each sieve is one of the major tools used to judge, analyze, and
classify soil.
The quantities of each are
determined by a laboratory analysis that separates the soil into groups of
particle sizes. The standard methods of
test prescribed by AASHTO T-88 and ASTM D-422
have been used widely in highway engineering and are used by the Department.
The distribution of particle
sizes larger than 0.074 mm retained on the No. 200 (75 μm)
sieve is determined by sieving, while the distribution of particle sizes
smaller than 75 μm is determined by a
sedimentation process, which uses a hydrometer to determine the necessary data.
Size definitions used by the
Department are the same as definitions used by AASHTO T-88 with the exception of clay:
|
Component |
Size |
|
|
Boulders |
Larger than 12 inches (300 mm) |
|
|
Cobbles |
3 to 12 inches (75 to 300 mm) |
|
|
Gravel |
Coarse |
¾ to 3 inches (19 to 75 mm) |
|
Fine |
#10 sieve to ¾ inch (2 to 19 mm) |
|
|
Sand |
Coarse |
#40 sieve to #10 sieve (0.42 to 2.0 mm) |
|
Fine |
#200 sieve to #40 sieve (0.074 to 0.42 mm) |
|
|
Silt |
0.005 to 0.074 mm |
|
|
Clay |
Smaller than 0.005 mm |
|
Texture
The amount of each soil type
(i.e., boulders, cobbles, silt, and clay) contained in a soil mixture
determines its texture or feel. Soil
classifications by texture must not be confused with soil classifications for
engineering purposes. Sometimes these
classifications are similar, but other times they may be different. The amount of each soil type in a soil
mixture is determined by laboratory tests.
The test results are then compared with texture definitions in order to
determine texture name.
Soil texture is classified
after its sieve size is determined. It
is possible to make approximations of texture by the feel of moist soil when
rubbed and ribboned between the thumb and index
finger.
The texture of soil tells a
lot about the soil. Using texture
classification, approximations and estimations can be made of soil properties,
such as bearing value, water-holding capacity, probability to frost heave,
permeability, etc.
Soil Components
(Major and Secondary)
It is the practice of the
Department to describe soil components and texture of a soil as follows:
Major Components
Major components are
described as gravel, sandy gravel, gravelly sand, sand, silty sand, clayey
sand, sandy silt, silt, clayey silt, silty clay or clay. More than 35 percent of the total sample is
required in order to classify a major component. Where two words are used to describe the
major component, the second word describes the greater quantity.
Examples: Sand predominates in silty sand while silt
predominates in sandy silt.
Secondary Components
Descriptions of secondary
components are preceded by the term listed below, according to the percent of
total sample indicated:
|
Term |
Percent of Total
Sample |
|
Trace |
0 to 10 |
|
Little |
10 to 20 |
|
Some |
20 to 35 |
|
And |
35 to 50 |
Examples of material texture
descriptions based on component test results are as follows:
|
Material Components |
Texture Description |
|
Sand 30%, silt 55%, clay 15% |
“sandy silt with little clay” |
|
Sand 8%, silt 55%, clay 37% |
“silt and clay with trace sand” |
|
Gravel 20%, sand 68%, silt 12% |
“gravelly sand with little silt” |
|
Gravel 2%, sand 12%, silt 42%, clay 38% |
“silt and clay with little sand, trace gravel” |
Internal Friction
Internal friction is defined
as the resistance to sliding within the soil mass. Gravel and sand impart high internal friction
and the internal friction of a soil increases with sand and gravel
content. For sand, the internal friction
is dependent upon the gradation, density, and shape of the soil particle, and
is relatively independent of the moisture content. Clay has a low internal friction, which
varies with the moisture content. A
powder-dry, pulverized clay has a much higher internal friction than the same
soil saturated with moisture since each soil particle can slide on adjoining
soil particles much more easily after it is lubricated with water.
Various laboratory tests have
been devised to measure internal friction.
It is defined as the angle whose tangent is the ratio between the
resistance offered to sliding along any plane in the soil and the component of
the applied force acting normal (perpendicular) to the plane. Values are given in degrees. Internal friction values range from 0 degrees
for clay, just below the liquid limit, to as high as 34 degrees or more for a
dry sand. Very stiff clay may have a
value of 12 degrees.
The governing test should be
based on the most unfavorable moisture conditions that will prevail when the
soil is in service. This “angle of
internal friction” is not the same as the natural angle of repose or degree of
slope on the soil in fills.
Cohesion
Cohesion is defined as the
mutual attraction of particles due to molecular forces and the presence of
water. The cohesive force in a soil
varies with its moisture content.
Cohesion is very high in clay but of little or no significance in silt
and sand. Powder-dry, pulverized clay
has low cohesion. However, as the
moisture content is increased, the cohesion increases until the plastic limit
is reached. The addition of more
moisture reduces the cohesion. By
partially over-drying wet clay, most free water is removed and the remaining
moisture will hold the clay particles firmly together. This will give the soil
such high cohesion that a hammer may be required to break the particles
apart. These conditions are illustrated
by the dry dirt road in summer that dusts easily, but carries large loads; the
muddy, slippery road of spring and fall; and the hard-baked surface of a road
immediately after summer rains.
Various laboratory tests have
been devised to measure cohesion.
Results are usually given in pounds per square foot (psf) or kilopascals
(kPa) and may vary from 0 psf in dry sand and wet
silt to 2,000 psf (96 kPa) in very stiff clays. Very soft clays may have a value of 200 psf
(10 kPa). The
governing test should be based on the most unfavorable moisture condition that
will prevail during service.
Internal Friction
and Cohesion
The stability and the structural
properties of soil are determined largely by the combined effects of internal
friction and cohesion. In most soils
these combine to make up the shearing resistance. The combined effects are influenced by other
basic factors, such as capillary properties, elasticity, and compressibility.
All of these factors, plus
the site on which the soil is located, determine the moisture content that will
prevail in the soil in service. They
also govern the load-carrying capacity of a soil, which is the primary
concern. The clay-gravel road made up
largely of gravel and sand, with a small amount of silt to fill voids, and a
small amount of clay to give cohesion, illustrates a soil of high bearing
value. This soil is produced by high internal friction due to sand and gravel
and high cohesion due to clay. Clay
illustrates a soil of low bearing value. When clay is wet, internal friction is
negligible since no coarse grains are present, and cohesion is low since it has
been destroyed by moisture. The same
clay, air-dry, will have high bearing value due to high cohesion brought about
by the removal of moisture.
Capillarity
Capillarity is defined as the
action by which a liquid (water) rises in a channel above the horizontal plane
of free water. The number and size of
the channels in a soil determine its capillarity. This soil property is measured as the
distance moisture rises above the water table and will range from 0 in some
sand and gravel to as high as 30 feet (9 meters) or more in some clay
soils. It often requires a long period
of time for water to rise to the maximum possible distance in clay soils
because the channels are very small and frequently interrupted, and the
frictional resistance to water is great in the tiny pores.
Moisture in silt soils may be
raised by capillarity only 4 feet (1 meter) or so. Since the capillary pores are larger than for
clay, a larger quantity of water is raised in a few days rather than over a
long period. Silts are considered to
have “high capillarity” by geotechnical engineers because of this rapid rise of
water. The capillary rise in gravels and
coarse sands varies from zero to a maximum of a few inches.
Complete saturation of soil
seldom occurs at the upper limits of rise in capillary moisture. Capillarity of
a soil and the elevation of the water table under the pavement determine
whether the subgrade will become saturated in this manner. Whether or not the subgrade becomes saturated
from capillary action, or from condensation, seepage, etc., determines the
bearing value of the soil to a considerable extent. Subgrade saturation by capillarity determines
whether frost heave and similar occurrences in subgrade will create a problem
requiring treatment for satisfactory performance in service.
Compressibility and Elasticity
Compressibility and
elasticity are the properties of a soil that cause it to compress under load or
compaction effort and to rebound or remain compressed after compaction. Most soils are compressible. Silty soils of the A-5 group are the most
elastic of Ohio soils and make poor subgrades for pavements. Fortunately, A-5 soils are limited in
occurrence in Ohio. The A-7 soils in
Ohio are moderately elastic, but do not present special problems in embankment
or subgrade. A-4 soils are elastic under
some moisture conditions, and sometimes present problems of stability during
construction, but provide adequate support for pavements where good design and
construction practices have been followed.
Soil elasticity measurement
is determined by special tests that simulate moisture changes and loading
conditions anticipated in the field.
Elasticity and
Deformation of Soils
When heavy rubber-tire
construction equipment moves over an embankment layer foundation of wet,
fine-grained soil, some movement of the embankment surface occurs. Elastic movement occurs when a tire moves
onto an area, the surface is deformed, and when the tire moves off the area,
the surface rebounds, or springs back, with little or no permanent rutting of
the surface. Cracking of the surface may
or may not occur following this type of movement.
Cracking may occur in cases
of pronounced elasticity. In the case of
pronounced elasticity or deformation, there is displacement of surface soil to
each side of the tire, which results in deformation, rupture, cracking, and
rutting.
The magnitude of the elastic
movement or deformation may depend on one or more factors:
- Weight of equipment.
- Size of tires.
- Tire pressure.
- Soil moisture.
- Type of soil.
- Depth of soil layer.
- Stability of material
underlying the soil layer being observed.
Some embankment elasticity
and deformation is expected under construction equipment loading. Moderate movement of less than a 1/2 inch (13
mm) can occur with heavy equipment weighing around 35 tons on embankments of
satisfactory stability. This moderate
movement is not considered detrimental.
Greater movement is likely on adequately stable embankments under very
heavy equipment weighing greater than 35 tons.
Except for specialized situations, such as soft foundation soil at
shallow embankment depth, under the layer being observed, the greater movement
due to these very heavy loads is not detrimental. In general, elastic or deformation movement
under heavy or very heavy loads should be permitted if the moisture of the embankment
is at least 2 percent below optimum.
Moisture control
specifications are not intended to limit or restrict the use of very heavy
construction equipment on embankment construction. The intent of the specifications is to limit
the moisture to obtain a stable embankment.
The amount of elasticity and
permissible deformation under any given load varies with job
circumstances. For example, for the
first layer over a soft, original ground embankment foundation, considerable
movement under loaded construction equipment is inevitable due to the soft
foundation material. The resistance to
deformation is more critical in the top portion of embankment, near the
subgrade, than in lower portions of the embankment. If the lower embankment layers are
low-stability material, such as wet silt, elasticity and deformation of the
lower embankment layer must be closely monitored. This would not be necessary if successive
embankment layers were made of high stability material, such as rock, shale,
granular material, or dry soil.
Equipment which can be used
successfully to test for embankment stability includes rubber-tired roller,
grader, loaded scraper, or loaded truck.
More movement is to be expected under very heavy equipment than under heavy
equipment ordinarily used in highway work.
When rubber-tire construction equipment, such as scrapers, graders, or
rollers are being used over the entire general area during normal embankment
construction operations, and observation shows no area of questionable
stability; it is not necessary to have a piece of testing equipment
systematically cover the entire area to observe stability.
When the Engineer or
Inspector questions or desires to check the stability of an area during
embankment construction, they are authorized to require that the Contractor
moves suitable equipment over the area to check for pronounced elasticity or
deformation.
The determination of
pronounced elasticity or deformation under the action of loaded rubber-tire
construction equipment is based on the description given in the second
paragraph of this section.
The administration of this
requirement should be tempered with sound judgment backed by construction
experience.
Shrinkage
Shrinkage refers to the apparent
decrease in volume of a soil during its removal from the cut or borrow and its
placement in the embankment. Shrinkage
is caused by a greater density in the fill than in the cut or borrow area. Shrinkage is not accounted for nor
contemplated in the design of the project.
The amount of shrinkage
resulting from increased density in the embankment material may be estimated by
using a volume or dry density basis.
Either one of the following
equations can be used to calculate the Shrinkage Factor (SF).
![]()
![]()
Example
of the use of a shrinkage factor:
![]()
The adjustment due to
shrinkage is only used where the material is measured in a borrow pit and the
embankment is placed outside of the plan allowed tolerances. Due to specification and design changes, the
use of borrow as a pay item should be minimized in the future.
Settlement and
Scalping Losses
Losses due to scalping are
usually insignificant as a percentage of the overall embankment construction
quantities. Scalping losses of around 6
inches from the original cross-sections can be expected during construction.
This is not compensated by the Department.
If there is significant losses beyond this, it can be accounted for by
taking cross-sections and then compensation should be made.
Settlement of the embankment
foundation can be an area where the contractor can lose material that is not
measured directly. It can be accounted
for in the earthwork quantity calculations.
Losses due to settlement of
the embankment foundation, where the foundation is compressible, can be
calculated by using settlement platforms.
A settlement platform, or several platforms, can be placed on the
foundation. The platform is measured
throughout the life of the embankment construction. A settlement verses time curve can be used to
determine the amount of additional payment that is due. See Figure 203.I.
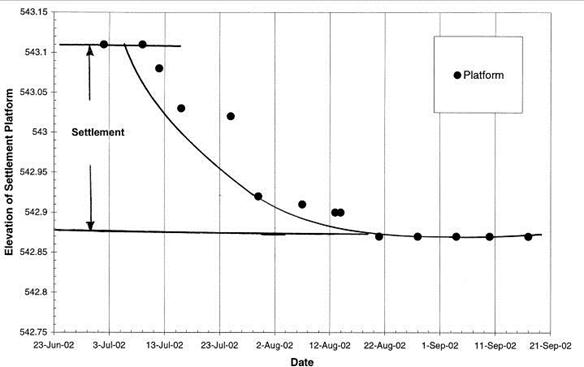
Figure
203.I – Settlement Curve
The amount of settlement that
occurred over the life of the embankment construction is a function of this
Total Settlement Curve. To make the
additional embankment payment, multiply the settled amount by the length and
width of the settled area. This length
and width should be calculated at the half height of the embankment in the
affected area. Some judgment is required
regarding the length of influence of individual or multiple settlement
platforms.
Example of total settlement:
543.11 - 542.88 = 0.23 feet
Permeability
Permeability is a property of
soil that allows it to transmit water. It is defined as the rate at which water
is transmitted by soils. Permeability
depends on the size and number of soil pores as well as the difference in
height of water at the point where it enters the soil and the point where it
emerges. It is determined by tests on a
representative soil sample and expressed as the coefficient of permeability,
and it equals the velocity of water-flow in centimeters per second (cm/sec)
under a hydraulic gradient of 1. A
hydraulic gradient of 1 exists when the pressure head (or height of water) on
the specimen in centimeters divided by the depth of the specimen in centimeters
equals 1.
The permeability of a soil
varies with factors such as void ratio, particle size and distribution,
structure, and degree of saturation. The
permeability of a particular soil will vary with the degree of compaction since
this will influence the size of soil pores.
A particular soil, loosely packed, will be more permeable then the same
soil tightly packed. Nature produces
these differences along with shrinkage forces that may be present by surface
freezing in winter (loosening a soil) and by repeated wetting and drying in the
summer (consolidating the soil).
The coefficient of
permeability, k, is used to determine the quantity of water that will seep
through a given time and distance under a known head of water. It is calculated using the following
equation.

The equation can be
rearranged to find the quantity of seepage, Q, as shown below.

Q = Quantity of water, in cubic centimeters (cm3)
k = Coefficient of permeability, in centimeters
per second (cm/sec)
H = Hydrostatic head, in centimeters
L = Thickness of soil, in centimeters, through
which flow of water is determined under hydrostatic head H;
A = Cross-sectional area of material, in square
centimeters (cm2);
t = Time, in seconds (sec).
Tile can drain very porous
soils, such as sands that have a k of 1.0 to 10-3 (0.001)
cm/sec. Silty and clayey sand soils have
a k of about 10-3 (0.001) to 10-7 (0.0000001)
cm/sec. Highly cohesive clays have a k
of less than 10-8 (0.00000001) cm/sec. It is difficult, if not impossible, to reduce
the water content of soils by tile drains when the permeability coefficient is
less than 10-3 (0.001). For
earth dams, the U.S. Bureau of Reclamation classifies soil with k values
approximately 10-4 (0.0001) as pervious and soil with k below 10-6
(0.000001) as impervious.
Soil Group classifications
A-6a, A6b and A-7-6 are generally considered impervious.
Plastic Limit
The plastic limit (PL) of
soils is the moisture content at which a soil changes from a semisolid to a
plastic state. This condition is said to
prevail when the soil contains just enough moisture that it can be rolled into
1/8 inch (3.18 mm) diameter threads without breaking. The test, ASTM D-4318 or AASHTO T-90, is conducted by trial and error, starting
with a soil sufficiently moist to roll into threads 1/8 inch (3.18 mm) in
diameter. The moisture content of the
soil is reduced by alternating manipulation and rolling until the thread
crumbles.
Clay content controls the
plastic limit. Some silt and sand soils
cannot be rolled into 1/8-inch (3.18 mm) threads at any moisture content; these
have no plastic limit and are termed non-plastic. The test is of no value judging the relative
load-carrying capacity of non-plastic soils.
A very important change in
load-carrying capacity of soils occurs at the plastic limit. Load-carrying capacity increases very rapidly
as the moisture content is decreased below the plastic limit. On the other hand, load carrying capacity
decreases very rapidly as the moisture content is increased above the plastic
limit.
Liquid Limit
The liquid limit (LL) is the
moisture content at which a soil passes from a plastic to a liquid state. The test, ASTM D-4318 or AASHTO T-89, is performed by determining, for various
moisture contents, the number of blows of the standard cup needed to bring the
bottom of the groove into contact for a distance of more than 1/2-inch (12.7
mm). These data points are then plotted
and the moisture content at which the plotted line (called flow curve) crosses
the 25 blow line is the liquid limit.
Sandy soils have low liquid
limits of the order of 20. In these
soils the test is of little or no significance in judging load-carrying
capacity.
Silts and clays have
significant liquid limits that may run as high as 80 or 100. Most types of clay in Ohio have liquid limits
between 40 and 60.
High liquid limits indicate
soils of high clay content and low load-carrying capacity.
Liquid limit can be used to
illustrate the interpretation of moisture content as a percentage of the
oven-dry weight of the soil. See an
example in the previous section on liquid limit.
Plasticity Index
The plasticity index (PI) is
defined as the numerical difference between liquid limit and plastic
limit. Calculation details are included
in ASTM D-4318 or AASHTO T-90. The
plasticity index gives the range in moisture contents at which a soil is in a
plastic condition. A small plasticity
index, such as 5, shows that a small change in moisture content will change the
soil from a semisolid to a liquid condition.
Such a soil is very sensitive to moisture unless the combined silt and
clay content is less than 20 percent. A
large plasticity index, such as 20, shows that considerable water can be added
to the soil before it changes from a semisolid to a liquid.
When the liquid or plastic
limit cannot be determined, or when the plastic limit is equal to or higher
than the liquid limit, the plasticity index is considered non-plastic (NP).
The moisture conditions at
the plastic limit and liquid limit, and the plasticity index, often are called
the “Atterberg Limits” (named after Albert Atterberg, the Swedish agricultural scientist who developed
the concept).
Detailed Description
of the Soil Classification Groups
The following is a brief
description of the materials in each classification group detailed in Figure
203.G.
Group A-1
The typical material of this group
is a well-graded mixture of gravel stone fragments, coarse sand, fine sand, and
a non-plastic or feebly plastic soil binder.
However, this group may also include the same material without the soil
binder.
Subgroup A-1a
This material predominantly
consists of stone fragments or gravel, either with or without a well-graded
soil binder.
Subgroup A-1b
This material predominantly
consists of coarse sand with or without a well-graded soil binder.
Group A-3
The typical material of this
group is fine beach sand without silty or clay fines or with a very small
amount of non-plastic silt. The group
also includes stream-deposited mixtures of poorly-graded fine sand and limited
amounts of coarse sand and gravel. These
soils are sometimes difficult to compact, similar to the A-4 group. The fineness of the material and the silt
fines make stabilization difficult. See
the group A-4 for further explanation.
Subgroup A-3a
This material consists of
mixtures of coarse and fine sand with limited amounts of low plasticity silt.
Group A-2
This material consists of a
wide variety of granular materials which borderline between Groups A-1 and A-3
and the silt-clay materials of Groups A-4, A-5, A-6 and A-7. It includes all materials containing 35
percent or less passing the No. 200 (75 μm)
sieve which cannot be classified as A-1, A-3 or A-3a, due to fines content or
plasticity (or both) in excess of the limitations for those groups.
Subgroups A-2-4 and
A-2-5
This material consists of
various granular materials containing 35 percent or less passing the No. 200
(75 μm) sieve and with a negative No. 40 (425 μm) portion which have the characteristics of the A-4
and A-5 groups.
This material consists of
materials such as gravel and coarse sand with silt contents of plasticity indexes
in excess of the limitations of Group A-1, and fine sand with non-plastic silt
content in excess of the limitations of Group A-3. A-2-5 soils are unsuitable embankment
material under 703.16.B because of its low weight, high optimum
moisture, high LL, low PI, and its propensity to sloughing in service.
Subgroups A-2-6 and
A-2-7
This material consists of
materials similar to those described under Subgroups A‑2‑4 and
A-2-5 except that the fine portion contains plastic clay which has the
characteristics of the A-6 or A-7 group.
The approximate combined effects of plasticity indexes in excess of 10,
and percentages passing the No. 200 (75 μm)
sieve in excess of 15, are reflected by group index values of 0 to 4.
Group A-4
The typical material of this
group is a non-plastic, or moderately plastic, silty soil usually having 75
percent or more passing No. 200 (75 μm)
sieve. This group also includes mixtures
of fine, silty soil and up to 64 percent of sand and gravel retained on No. 200
(75 μm) sieve.
The group index values range from 1 to 8, with increasing percentages of
coarse material being reflected by decreasing group index values. The A-4 group soils are usually very
difficult to compact or stabilize.
Minimizing the water content to obtain the required density and
stability usually works. It is not
unusual, nor is it a change in condition, to have difficulty in stabilizing or
compacting these soils. This condition
should be expected for this type of material.
Subgroup A-4a and
A-4b
Subgroup A-4a contains less
than 50 percent silt sizes. Subgroup
A-4b contains more than 50 percent silt sizes.
A-4b is only allowed 3.0 feet (1.0 m) below subgrade elevation because
of frost heave potential. Both are
susceptible to erosion.
Group A-5
The typical material of this
group is similar to that described under Group A-4, except that it may be
highly elastic as indicated by the high liquid limit. The group index values range from 1 to 12,
with increasing values indicating the combined effect of increasing liquid
limits and decreasing percentages of coarse material. This soil is unsuitable under 703.16.A for
use as embankment material because of its elasticity.
Group A-6
The typical material of this
group is a plastic clay soil which has 75 percent or more passing the No. 200
(75 μm) sieve.
The group includes mixtures of fine clayey soil and up to 64 percent of
sand and gravel retained on the No. 200 (75 μm)
sieve. Materials of this group usually
have high volume changes between wet and dry states. The group index values range from 1 to 16,
with increasing values indicating the combined effect of increasing plasticity
indexes and decreasing percentages of coarse material.
Subgroup A-6a and
A-6b
Subgroup A-6a contains
material with plasticity index of 15 or less.
Subgroup A‑6b contains material with a minimum plasticity index of
16.
Group A-7
The typical material of this group
is similar to that described under Group A-6, except that it has the high
liquid limit characteristics similar to that of group A-5, and may be elastic
as well as subject to high volume change.
The range of group index values is 1 to 20, with increasing values that
indicate the combined effect of increasing liquid limits and plasticity indexes
and decreasing percentages of coarse material.
Subgroup A-7-5
Includes those materials with
moderate plasticity indexes in relation to liquid limit and may be highly
elastic as well as subject to considerable volume change. This soil is unsuitable under 703.16.A
because of its elasticity.
Subgroup A-7-6
Includes those materials with
high plasticity indexes in relation to liquid limit and are subject to
extremely high volume change.
Slag Materials (203.02.Q)
Slags are by-products from
manufacturing steel or iron. Under 203.02.Q,
Air-Cooled Blast Furnace slag (ACBF), Granulated slag
(GS), Open Hearth (OH) slag, Basic Oxygen Furnace (BOF) slag, and Electric Arc Furnace (EAF)
slag that meet the requirements in 703.16 are allowed under Item 203.
Air Cooled Blast
Furnace Slag
Air Cooled Blast Furnace slag
is a by-product from making iron. It is
a very hard and durable aggregate, which contains visible holes. ACBF slag may have
a maximum dry density of approximately 80 lbs/ft3 (1280 kg/m3)
and is lighter than most soils.
ACBF slag can produce a green, yellow, white, or black
runoff; the color is usually pH driven.
This runoff can smell like rotten eggs and usually goes away in 6
months, but not always. The runoff may
exceed the allowable limits under the Clean Water Act.
The potential for the runoff
to exceed the Clean Water Act is based on the following factors:
- The contaminate
concentration of the ACBF slag.
- The permeability of
the ACBF slag.
- The geometry of the
in-place system. ACBF slag next to an underdrain has a higher potential
than ACBF slag located in a fill surrounded by
clay.
- The amount of water
flowing through the system.
- Time of contact with
the slag. Stagnant water around
slag increases the potential for problems.
To minimize this problem in
embankment construction, ACBF slag must pass the
Sulfur Leachate Test described in Supplemental Specification 1027. The manufacturers are required to certify
that their material meets this requirement.
Contact the District Testing Engineer or the Aggregate Section of the
Office of Materials Management to verify that the material may be used.
Further details about the
potential problems can be found in Other Wastes and Environmental
Considerations in Section 202, Regulated Waste Requirements, of this manual.
Granulated Slag
Granulated Slag (GS) is a by-product of making iron or steel. GS is a slag that
has been quenched with water during the cooling process instead of
air-cooling. Most of the granulated
slags are iron slags. If steel slags are
quenched with water they may cause explosions.
Steel slag has about 20 to 25 percent iron in the slag, while iron slag
has less than 1 percent. It is a very
light and brittle material, almost like powder in the pre-compaction
condition. After compaction, it is very
hard, durable, and almost impermeable.
This material sets up like concrete in service. The maximum dry density can range from 50 to
90 lbs/ft3.
Steel Slags
Steel slags are by-products
of making steel. There are three kinds
of steel slag defined in 203.02.Q:
OH slag, BOF slag, and EAF slag. OH slag is the slag that was produced mainly
pre-1970; however, some OH slag was made in the 1970’s. BOF and EAF slags are newer and faster processes for making steel;
however, some BOF plants were in operation in the
late 1950’s.
The problems associated with
steel slags are worse for EAF and BOF
slags than for OH slag. The process for
making OH slag is slower than the other two materials. This slower process allows more of the
harmful chemicals to be burnt out of the OH slag. Consequently, OH slag is a better product for
embankment applications.
Some steel slags can expand,
clog up underdrains, or have a high pH runoff. The specifications were written to minimize
these problems. Similar to ACBF slag, the following factors were considered when writing
the specification requirements:
- The contaminate
concentration (mainly MgO and CaO) of the steel slag.
- The permeability of
the steel slag.
- The geometry of the in
place system.
- The amount of water
flowing through the system.
- Time of contact with the
slag. Stagnant water around slag
increases the potential for problems.
- The load or weight on
the material.
Further details can be found
in Other Wastes and Environmental Considerations in Section 202 Regulated Waste
Requirements. OH, BOF, and EAF
slags may be used in embankment construction if the materials comply with
Section 703.16.
Section 703.16 requires that OH, EAF,
and BOF slag be blended with natural soil or natural
granular material. For OH slag, the
blend must be at least 30 percent natural soil or natural granular
materials. For BOF
or EAF slags, the blend must be at least 50 percent
natural soil or natural granular material.
The OH, EAF,
and BOF slag must also comply with Section 703.15,
which states that the aging, stockpiling, deleterious substances, and crushing
requirements of 703.14 apply.
OH, EAF,
and BOF slag and blends are further restricted in
203.03.E and 203.03.F. These materials must be at least 1 foot (0.3 m) below
the underdrains to minimize underdrain clogging.
These materials cannot be used underwater because of the potential pH problems.
All of the above restrictions
minimize the factors that can lead to expansion, clogged underdrains,
or high pH runoff problems.
Granular Embankment
Material Types ( 703.16.C )
These materials replace the
old granular embankment requirements under the 1997 specification book. The old requirements were too loose, and just
about any material could pass as granular material, even though it may not fit
the engineering or designed need in the plans.
In 703.16.C , the following
kinds of material are allowed: limestone (crushed carbonate stone or CCS),
gravel, ACBF slag, durable sandstone, durable
siltstone, GS, or blended natural soil or granular
materials with OH, BOF, EAF,
or RPCC.
Durability requirements for
sandstone and siltstone were previously covered in this manual under Natural
Granular Materials 203.02.H . The slag
requirements were previously covered in, Slag Materials 203.02.Q , of this
manual. RPCC
will be covered later in this manual and must be blended similar to the
slags. GS was
previously covered and is not required to have a specific gradation.
Six different gradations, or
types, are available for use in construction. Below is a general description of
these materials:
- Type A Granular
Material has less than 25 percent passing the No. 200 (75 µm) sieve.
- Used as a general
granular material with less fines.
- Probably going to
get sand most of the time. Sand is
less expensive and widely available.
- Gradation is too
open for bridging soft areas in the subgrade.
- Can be used to cover
soft embankment foundations in thick lifts, such as in swamp treatment
construction or with wick drains.
- Type B Granular
Material has the gradation of Items 304, 411, or 617, except 0 to 20
percent can pass the No. 200 (75 µm) sieve:
- Well-graded and
stable material.
- Can be used to
bridge soft subgrades or foundations.
- Must be drained to
be effective.
- Unstable in the
presence of free water.
- Type C Granular
Material has a top size of 3 inches (76 mm):
- It is well graded.
- Stable material and
resistant to water influences.
- Can bridge soft
areas better than Type B.
- Underdrains are difficult to construct through this
material.
- Type D Granular
Material has a top size of 8 inches (200 mm):
- It is well graded.
- Stable material and
resistant to water influences.
- Can bridge soft
areas better than Type B or Type C.
- Underdrains cannot be constructed through this material.
- Consider placing
geotextile fabric or 304 to prevent piping.
(See Figures 203.J and 203.K) - Type E Granular
Materials are very free draining and open materials:
- Coarse aggregates
from No. l through 67 are used.
- Used to bridge areas
that cannot be drained.
- Surround with
geotextile (712.09, Type D) or Type B or C Granular Material to prevent
piping. (See Figures 203.J and
203.K)
- Type F Granular
Material only has general requirements:
- Well graded
material.
- Top size from 8 to 3
inches (76 mm) with a bottom size of No. 200 (75 µm) sieve.
- Evenly graded
material between the top and bottom sizes.
- Compactable, stable,
and serves the intended use.
- Almost never
specified.
- Can mainly be used
to accept materials that do not meet the specific Type A thru E
requirements.
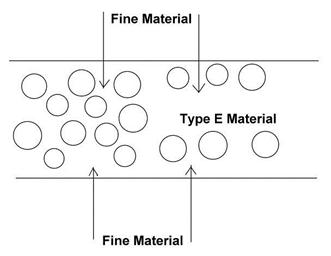
Figure
203.J – Fine Material Migration
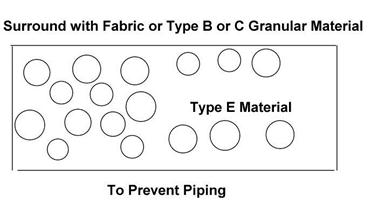
Figure
203.K – Preventing Piping
Rock ( 203.02.O )
The following rock
description is in the specifications: “Sandstone, siltstone, limestone,
dolomite, glacial boulders, brick, and RPCC too large
to be placed in an 8-inch (200 mm) loose lift.”
Rock fills are constructed differently than the construction of soil or
shale fills; therefore, it is important to clearly identify them in the field.
Rock Identification
It is important to understand
the differences in these materials and to have a basic understanding of their
origins.
Almost all rock in the state
of Ohio is sedimentary rock. Sedimentary
rock is formed by cementation, precipitation from solutions, or by
consolidation.
Sandstone is a deposition of
sand from rivers, wind, or oceans. This material was cemented together under
earth pressure or consolidation. Coarse
sandstone can be readily identified by the sand grains in the field. Fine-grained sandstone can be confused with
siltstone or limestone.
Limestone is calcite formed
from ocean deposits of sea organisms (seashells) that were cemented chemically
and/or by pressure. Chert
is similar to limestone, but it consists of silica minerals rather than
calcite. Dolomite is limestone with
magnesium and calcium carbonate.
Limestone or Dolomite can be
readily identified by using a solution of diluted hydrochloric acid. When hydrochloric acid is dropped on the
limestone or dolomite, the acid will fizz or bubble. The amount of fizzing depends on how much
calcium is in the rock. A pure dolomite
may not fizz unless the fines of the rock are tested.
Rock boulders are materials
brought from Canada during the glaciers and can consist of just about any
stone. The amount of earth pressure or
chemical crystallization greatly influences the hardness of the stone.
Shale ( 203.02.P )
According to the
specification, shale is defined as “A fine-grained sedimentary rock formed from
the lithification of clay, silt, or mud. Shale has a laminated structure, which splits
easily (is fissile). For the purpose of
this specification, mudstone and claystone are also
considered to be shale.” Laminated means
that it is made up of thin layers or sheets. Fissile means that the layers are
easily split apart.
The way we evaluate shale in
the field has changed from earlier versions of the specification. In the past, shale was identified and
compacted “as directed by the Engineer.”
The current approach gives the Engineer a systematic approach to
evaluate the shale to ensure long-term durability of the shale fill. It enables
the Engineer to identify these materials and to distinguish between durable and
nondurable shale.
Shale Identification
( 703.16.D )
Shale is a sedimentary
material that consists of silt or clay particles. Shale was formed when earth pressure squeezed
water out of silt and clay mud. Some
shale may be crystallized or cemented together into a stone like form.
Shale is evaluated for
durability as described below. The procedure is detailed in C&MS 703.16.D.
It is commonly called the Bucket Test.
1. Obtain a piece of shale
that is typical and representative of the rest of the shale. The size of the piece should be about 6
inches (150 mm). If a 6-inch (150 mm)
sample is not available, then the shale is nondurable.
2. Place the piece of shale
in a bucket of water. Examine the
deterioration or slaking of the shale after 48 hours. If the shale has deteriorated, then the shale
is nondurable.
3. If the shale has not
deteriorated after being in water for 48 hours, then break down the shale over
a 3/4-inch (19.0 mm) sieve by hand pressure.
If 75 percent or less of the shale is retained on the 3/4-inch (19.0 mm),
then the shale is nondurable.
4. If more than 75 percent of
the shale is retained on the 3/4-inch (19.0 mm) sieve or, then perform a field
test for durability. The field test for
durability consists of compacting the shale with six passes of a steel drum
roller which has a minimum compaction force of 500 pounds per lineal inch (57 kN/mm) of roller drum width. Ask the contractor for documentation to
verify the roller meets the compaction force requirement.
a.
If more than 40 percent of the shale breaks down, by visual inspection, then
the shale is nondurable.
b.
If less than 40 percent of the shale breaks down, by visual inspection, then
the shale is durable.
Different materials will
always be mixed together in a fill situation. However, the durability test will
give you a good indication of how the material should break down during
compaction. It also provides a ready
means to determine the test method to use for compaction acceptance. The compaction testing procedure for shale is
described in Supplement 1015, Compaction Testing of Unbound Materials, but it
is also summarized below.
- For durable shale,
treat it like rock. This means compacting it according to C&MS
203.06.C. There is no compaction
testing for durable shale.
- For nondurable shale,
if less than 25 percent is retained on the 3/4-inch (19 mm) sieve after
the Bucket Test, then compact and test the shale the same as soil. This means using direct transmission
mode of operation for the nuclear gauge and a one-point Proctor test for
determining the maximum dry density.
If the amount retained on the 3/4-inch sieve (19 mm) is between 10
and 25 percent, then also use an aggregate correction to determine the
maximum dry density.
- For nondurable shale,
if more than 25 percent is retained on the 3/4-inch (19 mm) sieve after
the Bucket Test, then compact and test the shale the same as granular
material. This means using
backscatter mode of operation for the nuclear gauge and a test section for
determining the maximum dry density.
The color of the shale can be
a good indication of the durability of the shale. Red shale in Ohio is always nondurable, while
grey, green, and black shale is generally, but not always, nondurable. Most durable shale in Ohio is grey or green.
Of course, the color of the shale is just a general guideline, and should never
be used as the sole criteria for durability. The durability of shale will
change depending on the project location and geologic formation.
Random Materials ( 203.03.L )
By definition, random
materials are “Mixtures of suitable materials that can be placed in 8-inch (200
mm) loose lifts.”
Other Allowed
Materials under 703.16 and 203.02
Asphalt Concrete ( 203.02.A and 703.16 )
Recycled asphalt concrete is allowed
if the material is less than 4 inches and is blended with at least 30 percent
natural soil or natural granular material.
The mixing and maximum size requirements are used to minimize the
effects of water on the asphalt consistency.
Place a piece of asphalt in a bucket of water and see what happens.
In addition, this material is
restricted in 203.03.A & B.
Portland Cement
Concrete ( 203.02.M and 703.16 )
Recycled Portland cement
concrete is allowed if the material is blended with at least 30 percent natural
soil or natural granular material.
Additional mixing requirements are in 203.06.D when used as random
material. This material is further
restricted in 203.03.B, E & F. This
material can clog underdrains and produce a lime
rich, high pH runoff similar to steel slags as discussed earlier.
Petroleum
Contaminated Soil ( 203.02.K and 203.03.J )
The use of Petroleum
Contaminated Soil (PCS) is regulated by law. The legal contamination level of
this material is listed in 203.03.J .
This material is usually
found around underground storage tanks.
The level of contamination is so low that you may not be able to see or
smell the petroleum in the soil.
Section 203.03.J requires
that an environmental consultant review the proposed use and test the
material. Submit the report to the
Chemical Section in the Office of Materials Management for approval.
Coal (703.16)
Coal is a very lightweight
material and is not very durable. It is
allowed in natural embankment materials when it comprises less than 10 percent
of the blend. It is impossible to keep
this material out of the fill on large earthwork construction projects.
Recycled Materials ( 203.02.N, 203.02.R and SS-871 )
The specifications define
recycled materials as fly ash, bottom ash, foundry sand, recycled glass, tire
shreds, other materials, or manufacturing by-products not specifically named as
suitable materials in 203.02.R.
The construction and
acceptance details are in Supplemental Specification 871.
These materials may have levels of contamination that must be controlled
and regulated by law. Like all other
materials ODOT uses, these materials are restricted and have certain
engineering properties that must be accounted for in the specifications.
A general discussion of the
specification is in Section 202, Regulated Waste Requirements, of this
manual. All supplemental specifications
can be found on the Division of Construction Management’s webpage on the
Department’s website.
The specification requires
environmental and geotechnical approval.
Submit the environmental report to the Chemical Section in the Office of
Materials Management for approval. The
geotechnical report and materials acceptance is approved by the Office of
Geotechnical Engineering.
Figure 203.L is a typical
application of recycled materials. These
materials are used in the inner core of the embankment structure. This controls
the chemicals leachate and minimizes the detrimental engineering properties.
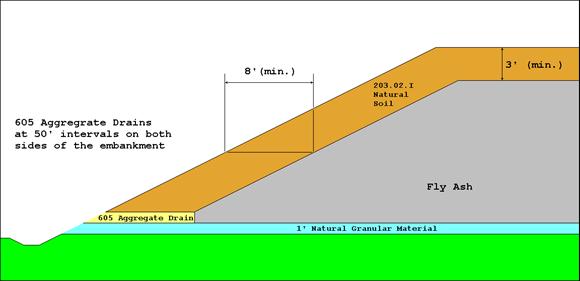
Figure
203.L – Typical Cross-Section for Recycled Materials
Figure 203.M details what can
go wrong if one uses a recycled material in the wrong fashion. Read the article and be careful. Further discussion about the recycled
material is beyond the scope of this manual.
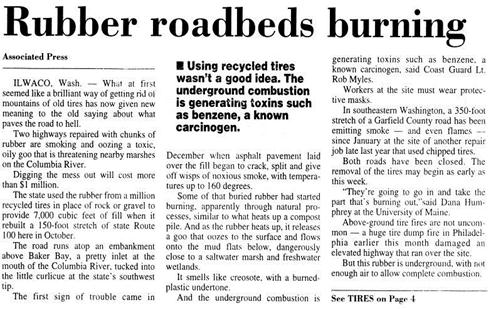
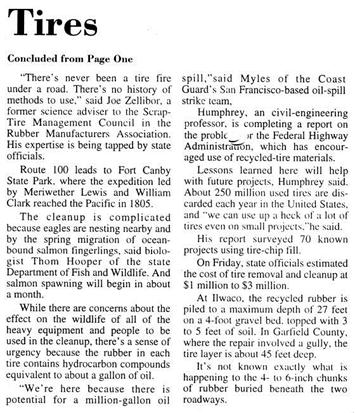
Figure
203.M-2 – Tire Fire (continued)
Restrictions (203.03)
Section 203.03 lists
materials restricted by the specifications.
These restrictions ensure that the embankment structural integrity is
sound in the short- and long-term. Keep
in mind that what seems to be a good product in the field may have serious
long-term consequences once in place.
Many of these restrictions were detailed in the previous sections in
this manual.
Many embankment materials are
allowed in several locations throughout the embankment structure. These allowable material types are further
restricted in the top 2 to 3 feet of the embankment to ensure long-term structural
integrity of the pavement.
Some of the general reasons
for these restrictions are:
- Water accumulates
under the pavement and deteriorates the material.
- Frost causes some
materials to heave and break down to smaller pieces.
- The load or stress at
this location is higher.
General
Construction (203.04)
This section details general
information about earthwork construction. No explanation is needed for most of
this section except for the following subsections.
Drainage and
Maintenance of the Work (203.04.A)
It is vital to the embankment
for the Contractor to maintain a well-drained construction operation. Contractors can provide proper drainage
without an enormous effort.
Here is some relevant text
from the specifications.
“Maintain a well-drained
embankment and excavation operation. … Construct the embankment with sufficient
cross-slope to drain in case of rain.”
Maintained cross-slopes
ensure that the rain runs off the embankment construction area instead of
filtering into the embankment. It is
difficult to remove water once it is in the embankment. Further embankment construction is
compromised once the existing embankment is saturated.
Using a saturated embankment
as a haul road can destroy the embankment structure and density. The following sentences are from the
specification.
“If precipitation saturates
the embankment construction, stay off the embankment construction until the
embankment dries or stabilizes. Expedite
the construction by removing the saturated embankment or dry the embankment by scarifying,
plowing, disking, and recompacting the embankment.”
The specifications continue
to give the project significant leverage to use with the following passage.
“Throughout the embankment
construction operation and at the end of each day’s operation, shape to drain,
compact, and recompact the work area to a uniform
cross section. Eliminate all ruts and
low spots that could hold water.
If using embankment
construction or cut areas to haul on, continuously move the hauling equipment
around on the area to take advantage of the compactive effort. Continually re-grade and compact the haul
roads and maintain the construction according to 105.13 and 105.14.”
Contractors will use a
multitude of excuses to avoid maintaining a well-drained embankment area. Some of them are legitimate and some are not. The project will have to use common sense in
evaluating them.
Staged Construction
(203.04.G)
Plans will often have fill
restrictions that mandate the monitoring of the fill height. The plans may call for limiting the fill
construction to 3 to 5 feet a week and may require waiting periods of 30 to 90
days.
In any case, these
restrictions usually mean that the embankment will be constructed on a soft
foundation. Limiting the load allows the foundation to consolidate slowly and
allows the pore pressure to dissipate so that the embankment does not fail.
In many cases it is required
that the project monitor the fill height, pore water pressure, and settlement
versus time. Figure 203.N shows such a
plot.
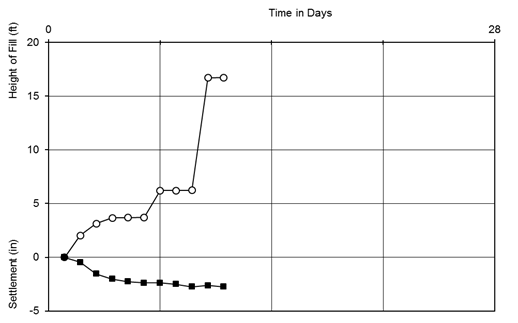
Figure 203.N – Settlement Plot
On the horizontal axis is a
plot of time, usually plotted in days.
The vertical axis shows both settlement and the fill height. You can
obtain a spreadsheet that will generate the settlement plot from the Office of
Geotechnical Engineering.
The plans will usually
specify a settlement waiting period.
This is an estimate by the designer as to how long the settlement will
take. However, the actual amount of time
it takes for the foundation to settle under the new embankment load is
dependent on the actual site conditions, and may be either more or less than
the estimate shown in the plans. The
standard plan note says that the Project Engineer may adjust the waiting period
based on the settlement readings. As a
general guideline, the settlement is usually considered complete when the
settlement readings result in 1/8 inch or less of settlement over a week of
time. The Contractor must include the
plan specified waiting period in the construction schedule. If the waiting period ends up being shorter,
then the Contractor can proceed ahead of schedule. If the waiting period ends up being longer,
then the Contractor may be eligible for a time extension due to an excusable
delay under C&MS 108.06.
The plans may also require
monitoring of the pore water pressure in some cases. When the pore pressure readings exceed some
threshold, the Contractor will have to suspend embankment construction until
the pore pressures dissipate. The plan
notes will give the pore pressure threshold, when to take baseline readings,
and minimum reading schedule.
Embankment
Construction Methods (203.05)
Foundation of
Embankments
If you recall from Section
201.04, scalping is not required if the
fill height is greater than 9 feet (3 m) and the existing slope is 8:1 or
flatter. Both conditions must apply for
the areas to be left un-scalped. Figure
203.O shows the conditions when scalping is required and when it is not.
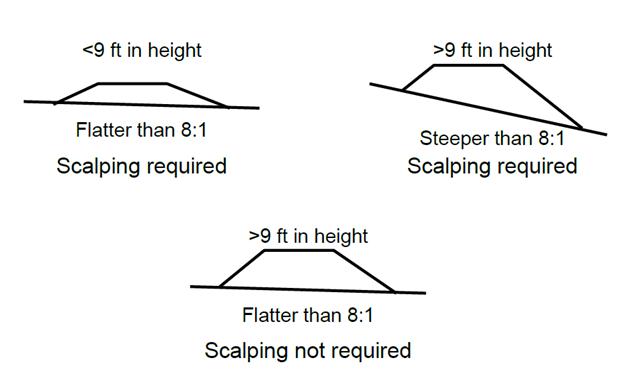
Figure
203.O – Scalping Requirements
There is a minimum compaction
requirement for all foundations that require scalping. The compaction requirement
is 95 percent of standard proctor or 95 percent of the test section maximum
value. This minimum value is easily
achieved. An alternate method may need
to be considered if density cannot be achieved.
Soft Foundations
Foundation conditions are occasionally
encountered that require treatment to obtain stability either within or beyond
what is proposed in the contract documents.
These soft foundation conditions do not take into account the long-term
settlement potential. The following details are to allow the project to
correctly construct the embankment in order to ensure a stable embankment. There are two general conditions detailed
below:
- Moderately Soft
Foundation:
- Low lying poorly
drained areas with high moistures.
- Soil unstable due to
extreme high moistures.
- Equipment rutting
less than 12 inches (0.3 m).
- Elastic or
pronounced elastic movement.
- All of the above are
constructible with moderate changes.
- Severely
Soft Foundation:
- Peat deposits.
- Swampy areas that
contain organic soil with high moisture.
- Underwater
conditions.
- Buried equipment.
- Un-constructible
with soil replacement.
The nature and degree of the
foundation instability will vary considerably.
Moderately Soft
Foundation
The first step in determining
the proper treatment for a soft foundation and ensuring embankment stability is
to determine and consider the following:
- Planned embankment height above
the foundation.
- Allowed construction time frame.
- Nature of the foundation
material.
- Moisture content.
- Location of free
water.
- Location of possible
outlets for drainage.
- Extent in depth and
area of unstable material.
- Type of embankment material.
The following types of
corrective measures have been used successfully for many years. Measures required to correct unstable
foundations often are apparent when the cause and extent of the instability are
known. The following sections consider
three different, moderately soft conditions that can occur during construction.
Embankment heights greater than 12 feet (4 m)
The higher the fill height
above the foundation, the better chance the project has in bridging over soft
foundation locations with very little additional expense.
Section 203.05 allows the
Engineer to increase the lift thickness to bridge soft foundation
locations. The specifications refer to
areas that do not support the weight of the trucks or hauling equipment (areas
with less than 12 inches (305 mm) of rutting or a moderately soft
foundation). For areas with more than 12
feet (4 m) of fill, this method should be the first alternative utilized.
Section 203.05 allows the
following technique when placing material over the soft foundation:
- Dump successive loads
of material in a uniform lift.
- Do not exceed the lift
thickness required to support the equipment placing the material.
- Manipulate, blade,
distribute, level, and doze the material until the area is stabilized.
- Once the bridging has
been accomplished, construct the remaining lifts according to 203.06.
This is standard practice in
soft foundation locations. Density
controls during this initial construction are not required. If the soft foundation is just wet and does
not have standing water, then soil dryer than optimum may be used.
If the foundation has
standing water, consider placing construction underdrains
or ditches to drain the soft areas (if the area can be drained). If the areas cannot be drained, then use
rock, granular material, or hard durable shale in 1 to 3 foot lifts (0.3 to 1
m).
Observe the embankment
stability once the bridging material is in place and make adjustments as
required. Reevaluate the conditions when
the embankment is 6 feet (2 m) below grade.
Embankment heights less than 12
feet (4 m), but more than 6 feet
Investigate the source of the
problem. Evaluating foundation
conditions is similar to evaluating the condition of a subgrade. Before determining the solution, first
evaluate the foundation conditions by digging test pits, evaluating the soil
borings and observing the rut depth.
Use the section, The
Investigation, under Item 204 of this manual, Figure 204.G Subgrade Test Pit
Investigation and Figure 204.H Subgrade Treatment Chart, to help evaluate the
foundation.
Determine the average N,
average U, and rut depth values using the above sections. Evaluating soft subgrade and soft foundations
is similar with a slight variation. If
the soft material is less than 2 feet (0.6 m) in depth, remove it and replace
with soil.
If the average U > 0.5
tons/ft2, average N > 5, and the rut depth is less than 6 inches (150
mm), then use an initial lift of soil that is about 1 to 3 feet (0.3 to 1 m)
thick. The soil should be less than
optimum moisture.
Do not use soil to bridge
areas with standing water or in conditions where some embankment has already
been placed as in the previous section.
If the soil conditions are
worse than these values or the rut depth is more than 6 inches (150 mm), then
use an initial lift thickness of 1 to 3 feet (0.3 to 1 m) of rock, granular
material, or hard durable shale.
If the slope allows the area
to be drained, drain the soft foundation by using construction underdrains or ditches.
Continue to evaluate the conditions when constructing the remaining fill
and adjust when required.
Embankment heights less than 6
feet (2 m)
If the source of the problem
has not been previously evaluated, then investigate the source of the problem
as detailed in the previous section.
Determine the average N,
average U, and rut depth values. Again,
evaluating soft subgrade and soft foundations are similar with slight
variations.
To determine the correct fix,
use the Subgrade Treatment Chart in Figure 204.H and find the correct undercut
depth or stabilization depth.
Subtract the fill height from
the recommended undercut depth to determine the required undercut depth in the
foundation. See Figure 203.P.
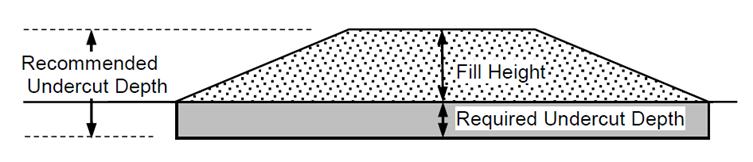
Figure
203.P – Fill Undercut Depth
Example:
Given:
New Construction Project
2 feet (0.6 m) of fill
U=0.5 tons/ft2, N=5 and Ruts > 6 inches
(150 mm)
From Figure 204.H Subgrade Treatment Chart,
recommended undercut depth = 3 feet (1 m)
Solution:
Required
undercut is 1 foot and place 3 feet (1.0 m) of Granular Material for the
fill. As an alternative, consider
stabilizing the foundation with cement or lime and then placing 2 feet (0.6 m)
of stabilized soil.
Severely Soft Foundations
Severely soft foundations are
conditions that cannot be constructed without using rock or granular
material. These conditions usually are
in standing water or even underwater.
Construction equipment either gets buried in the areas or cannot operate
in these locations. Peat deposits or
swampy areas that contain organic soil with high moisture are the norm in these
locations.
Unless these areas are called
out in the plans, it is best to contact the District Geotechnical Engineer or
the Office of Geotechnical Engineering to evaluate the depth and extent of the
required undercut.
This section examines two
different methods to remove and replace this soft material:
- Total Excavation
Method.
- Partial Excavation and
Displacement Method.
There will be plan notes
associated with these methods. The
following is a brief description of the construction methods of these two.
Total Excavation
Method
Below is a cross-sectional
view of the total excavation method.
This method, as the name implies, is used to where all of the soft
material can be removed down to a firm foundation.
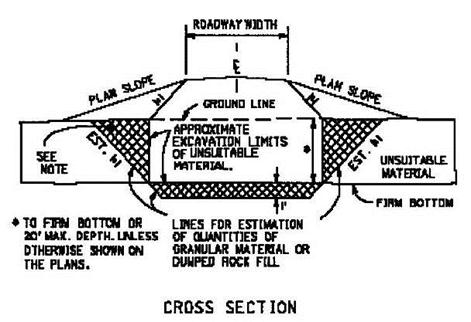
Figure
203.Q – Cross-Section View of a Total Excavation
The excavation and
backfilling progresses across the soft foundation for depths up to 20 feet (6
m) deep or the reach of the track hoe.
Below is a plan view of the same operation. The filling progresses at the same time as
the excavation.
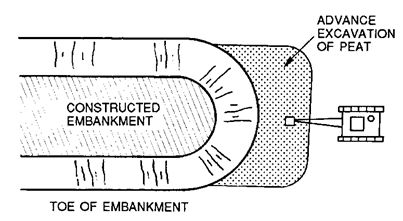
Figure
203.R – Plan View of the Filling and Excavation
Many times the excavation is performed
on the same side as the filling, the embankment side, but this takes some
coordination by the Contractor. Below is
the longitudinal view of the same operation.
The filling operation normally keeps the fill at least 1 foot (0.3 m)
above the soft material of water level.
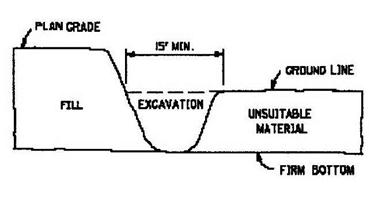
Figure
203.S – Longitudinal View of the Total Excavation
Partial Excavation
and Displacement Method
At times it is economical to
only remove portions of the soft foundation.
The cross-section view is shown below.
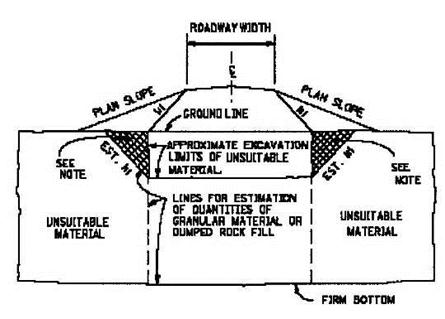
Figure
203.T – Partial-Depth Removal
Below is a longitudinal view
of the partial depth operation. A
surcharge of material is required to displace the soft material forward as much
as possible. The work needs to progress
across the soft foundation such that soft material does not get entrapped in
the replacement material. This is true
for either full- or partial-depth replacement.
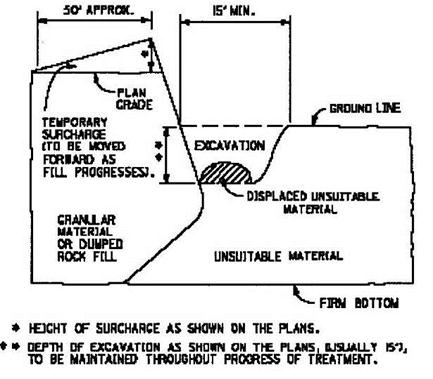
Figure
203.U – Longitudinal View of Partial Depth
In these operations, the plan
will denote which method of excavation is to be used for the work. In the past, the volume of the work was very
difficult to quantify. A new plan note
has been developed to simplify this measurement. The designer will choose the type of replacement
material that will replace the soft foundation material. Use a table similar to the one below to
convert the weight of the replacement material to volume.
Table 203.A – Conversion
Factors for Replacement Materials
|
Granular Materials |
Dumped Rock Fill |
||
|
Type |
Tons/Cubic Yard |
Type |
Tons/Cubic Yard |
|
A B C D E |
1.6 1.9 1.8 1.8 1.6 |
A B C D |
1.9 1.9 1.8 1.7 |
The replacement material may
be granular material or dumped rock fill.
Prior to the material being dumped into the soft foundation, weight tickets
are taken to finalize the replacement quantities estimated in the plans.
After the quantities for the
replacement materials, in tons, are known, the quantity is converted to cubic
yards using the above table. This cubic
yardage is used to determine the quantity of excavation to be paid. This simplifies the measurement of the
material that normally cannot be measured directly in the field.
Materials
The material used for this
operation may be granular material or rock fill types. Usually Granular Material Type C or D is used
for these conditions. Dumped Rock is
usually specified for depths greater than 10 feet (3.3 m). The project should check the potential for
piping. See Figures 203.J and 203.K.
Disposal of Material
The unsuitable excavated material
may temporarily be left in place or used for flattening adjacent slopes outside
the plan lines. This material must
either be shaped into the final slope or disposed of 2 weeks prior to paving
the project.
Consolidation Method
There is another method to
bridge a soft foundation. It is the
consolidation method. It was mentioned
in Section 203.04.G. It is beyond the
scope of this manual but a typical cross-section is presented below.
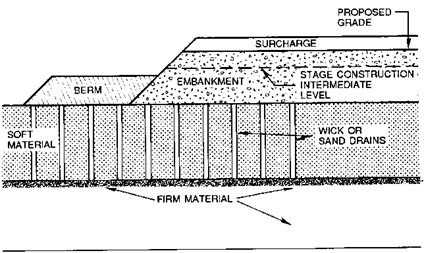
Figure
203.V – Consolidation Method
A layer of sand is placed to
bridge over the soft foundation usually around 3 feet thick. Wick drains are then placed through the
foundation soils. These wick drains
allow the pore pressure to dissipate faster as the fill is constructed.
Benching
Beginning with the 2002
C&MS, the language was more explicit than in the previous versions of
C&MS. This new language was put in
C&MS to ensure that benching is properly performed in the field. Figure 203.W details where benching is
required. Benching is required for all
embankments placed on or against a slope steeper than 8:1. Of course, the existing slope has to be
scalped first. This applies to all
embankment areas whether the existing embankment cross-slope is in the
transverse or the longitudinal direction.
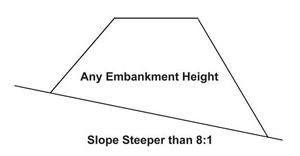
Figure
203.W – Benching Required
Figure 203.X details the
bench into the existing embankment. For
side hill fills, the existing embankment is physically notched out and
connected to the new embankment.
Benching requires horizontal cuts in the existing slope.
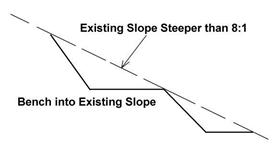
The bench needs to be wide enough
to blend the new embankment with the existing embankment. In Figure 203.Y, the total width between
point A and B must be the width of the dozer blade and the compaction
equipment.
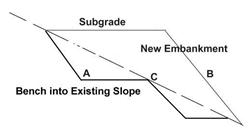
Figure
203.Y – Benching in New Embankment
If the plan calls for a new
embankment, or the distance between C and B is less than a blade width or about
8 feet, then the existing embankment must be benched in the difference, which is
the distance from A to C.
In Figure 203.Z, the
horizontal distance between points D and E is about 4 feet (1.3 m).
Therefore, the existing embankment must be benched into about 4 more feet (1.3
m) to complete the bench.
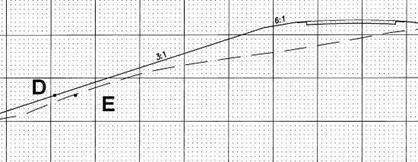
Bench into the slope as the
embankment is placed and compact into layers.
Begin each bench at the intersection of the existing slope and the
vertical cut of the previous bench. The
re-compaction of the cut materials is required.
Benching is nothing more than
a side hill foundation. Benching knits
two embankments together to ensure that a failure plane does not occur. Figure 203.AA details typical benching seen
on some plans.
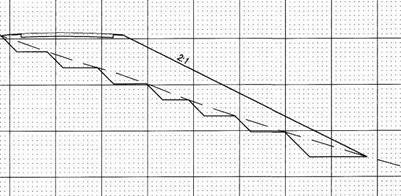
Figure
203.AA – Typical Benching
In this case, the designer
anticipated that there was a stability problem, or weak soils, in the existing
embankment (or both). This is called
special benching.
Side hill embankments present
unique problems; they may be stable when originally constructed, yet become
unstable later. The result is usually a
landslide.
If the bench is not benched
far enough into the existing embankment, a weak plane can develop as shown in
Figure 203.BB. A failure may occur along
this weak plane and the bench material will move laterally. The project should
evaluate the existing soil conditions and determine if more benching is
required than is shown on the plans or required by the specifications.
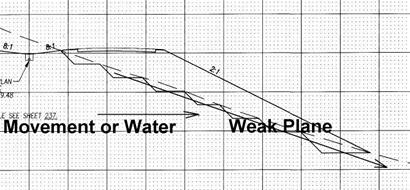
Figure
203.BB – Benching Problems
Bench Drainage
In many cases, the main cause
of an embankment benching failure is water related. Seeping water into the embankment from the
side hill or foundation can cause considerable instability in the existing and
the new embankment. Due to many factors,
water is an elusive quantity to capture during the design phase. Notice in Figure 203.BB how water can move
into the bench material and weaken it.
Special attention must be
given to side hill embankments. Consult
the plans and soil profile to see where special benching, if any, is required;
to see whether or not spring drains are provided; and to see if any potential
spring or wet zones are mentioned. The
areas should be inspected in detail for possible springs. In dry seasons, green or lush vegetation are
often indicative of a semi-dormant spring that may become active during
prolonged periods of precipitation. If
spring zones are encountered, and no spring drains are provided in the plans,
then drains should be added to the work.
If there is any indication of
water, drainage should be added if it is not already detailed in the
contract. The following pages detail
typical solutions to use in the field.
Spring drains are detailed on
the plan by plan note D109 and on the second sheet of Standard
Drawing DM 1.1.
Plan note D109 can be found in Location & Design Manual – Volume 2, Drainage Design. Links to the Location
& Design Manuals and the standard drawings can be found on the Design Reference
Resource Center on the Department’s web site.
The standard drawing is
partially shown in Figure 203.CC. The
standard drawing does not call for it, but it is recommended to use
non-perforated pipe outside the No. 57 stone and perforated inside the No. 57
stone. Wrap or coil the pipe inside the
No. 57 stone for maximum efficiency.
Completely wrap the No. 57 stone with Type A geotextile fabric. In many cases No. 8 stone can be substituted
for the No. 57 stone without sacrificing much drainage capacity and it also
reduces the risk of piping. The
application of a spring drain is used for local wet spots.
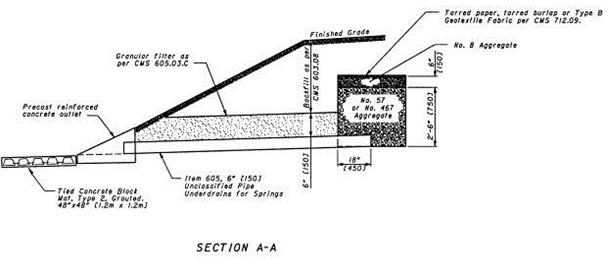
Severe Bench
Drainage Problems
Drainage always should be
added when the benching embankment is placed next to a rock or shale cut. In this case, add drainage along the entire
length and width of the shale/rock benching interface. Experience has shown that water always
leaches from this interface. If a large
quantity of water is coming into the bench, or water is leaching from several
locations and elevations, drainage should be added across the entire bench
face. In both examples above, a
different approach needs to be taken due to the severity of the water
issue. There are two potential solutions
to the severe drainage problems.
Adding Drainage when
Benching from the Top Down
If the slide repair benching
plan has 1 to 1 back slopes and consists of minimum 10 foot wide and high benches
and the slope can be excavated from the top of the cut all the way to the
bottom, then the following drainage should be considered.
The use of geotextile fabric
and No. 8 stone to take the water flow, as detailed in Figure 203.DD, is one
solution to solve the drainage issue.
The geotextile is used to stop the migration of fines into the No. 8
stone. Notice that the geotextile fabric
is used on both sides of the No. 8 stone to prevent migration from either side.
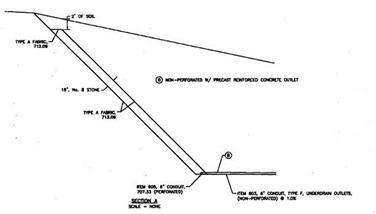
Figure
203.DD – Severe Water Problems in a Bench
The geotextile fabric
generally used is 712.09
Type A geotextile. The drainage
aggregate can be No. 8, No. 9, or No. 89 size.
The drainage pipe going into the page is a 6 inch, Item 605,
707.33 perforated pipe. The lateral
drain is a 6-inch, Item 611,
Conduit Type F non-perforated. This lateral drain backfill should be
surrounded by at least 12 inches (300 mm) of sand. This will provide a secondary outlet if the
pipe gets clogged.
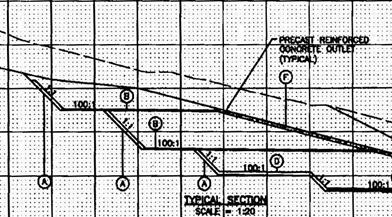
Figure
203.EE – Multiple Bench Layout
These benches can be interconnected
and outlet as detailed in Figure 203.EE.
Section A is the No. 8 stone and the geotextile fabric. Section B is the non-perforated pipe with an
outlet into Section F. Notice that the
bench and the pipe are outlet using a one percent grade or 100:1 slope. This ensures that the water can effectively
be removed from the system without leaching into the soil mass.
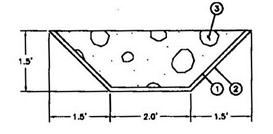
Figure
203.FF – Detail for outlet F
Figure 203.FF details the
outlet configuration. Balloon number two is a 20 mil plastic to prevent the
water from entering the soil along the slope.
Balloon number one details 712.09,
Type D geotextile fabric, which serves to protect plastic from getting torn
during rock installation. Balloon number
three details the Rock Channel Protection.
In this case, the rock type was Type C.
This rock type should be used in most cases.
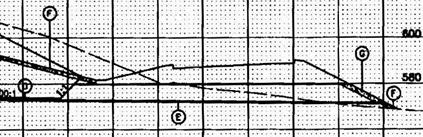
Figure
203.GG – Lower Bench Outletting
Figure 203.GG details the
lower benching. In the above slide
repair, the lower embankment was preexisting and did not require
reconstruction, but the lower benches
did need to be drained. The bench and
pipe drainage into the page of the cross-section was sloped at a one percent
grade. The slope of the outlet E from
left to right is sloped at a one percent grade.
The outlet pipe excavation was about 20 feet deep. This is a high risk operation during
construction. If necessary, this
construction can be done without trench boxes or laying back the slope. The trench is excavated in maximum 50 foot
lengths. The pipe is jointed together
above ground and dropped into the hole.
Grade is kept by conventional methods or by GPS. In this case, sand is dumped in the trench up
to an elevation 580. The sand should be
hoe rammed in place in thick lifts. In
this case, compaction requirements are secondary to the ability of keeping the
trench from collapsing. Keep the open trench as small as possible and no
personnel are to enter the trench during these operations.
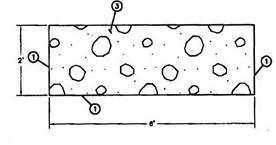
Figure
203.HH – Detail for Slope Protection G
After the outlet is
constructed, the outer slope will be sand for about 6 feet wide. Detail G in Figure 203.HH, details the
erosion protection required. A 712.09
Type D geotextile is placed under Type C Rock Channel Protection. The width of the material should be the width
of the sand.
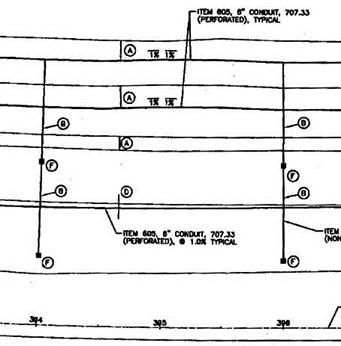
Figure
203.II – Top View of the Drainage
Figure 203.II details the
plan view of the drainage pattern in the slide repair. You will notice that the outlets are spaced at
200-foot intervals and the benches are sloped at a one percent grade toward
them. Notice that the high point on the
bench is 100 feet from the outlets and goes in both directions toward the
outlets.
When the benching cannot be
performed from the top down or the benches are small, another method of adding
drainage to the benching plan needs to be considered. Figure 203.JJ, shows adding a 20-foot
drainage trench to drain an upper, unstable slope (to the left) and to prevent
the embankment from becoming saturated.
The drainage into the page is sloped at a one percent grade.
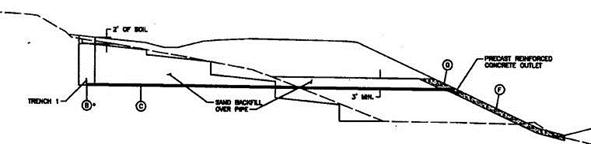
Figure
203.JJ – Using Trenching and Sand
Since this trench is around
20 feet deep it is a high risk operation during construction. If necessary, this construction can be done
without trench boxes or laying back the slope.
The trench is excavated in maximum 50-feet lengths. By keeping the
trench length to a small interval it minimizes the potential for collapse or
upper slope damage. The pipe is jointed
together above ground and dropped into the hole. Grade is kept by conventional methods or by
GPS. Sand is dumped in the trench
approximately 3 feet below ground level.
The sand should be hoe rammed in place in thick lifts. Compaction requirements are secondary to the
ability of keeping the trench from collapsing.
In Figure 203.KK below, the
above trenching technique is expanded to drain the entire counter berm. The drainage at the toe is provided by the
rock fill while the three trench drains to the left drain at third point
intervals along the existing new fill interface. The center two sand drains are placed at the
interface of the existing ground and the new embankment. The construction of the middle two sand
drains is slightly different than the other sand drain, but only slightly. The embankment is constructed to the top
elevation of the sand trench and the sand trench, pipe, and outlets are
constructed as previously described.
The sand that is generally
used for these operations is asphalt, concrete, or masonry sand. There is a possibility that the soil will
pipe into the sand or the soil will clog the sand. The possibility of this happening is
considered a small risk and is beyond the scope of this manual.
In Figure 203.JJ, the pipe in
section B is perforated and wrapped with geotextile fabric to prevent the sand
from piping in the pipe.
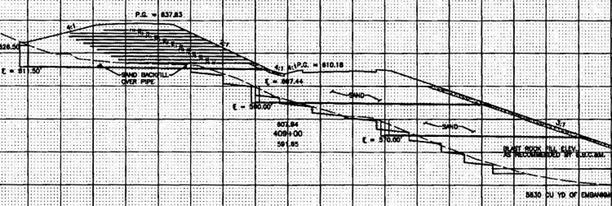
Figure
203.KK – Multiple Benching with Sand
Figure 203.LL details the
plan view of the drainage system, which is similar to that previously
detailed. The outlets are spaced every
200 feet and everything drains at a one percent slope.
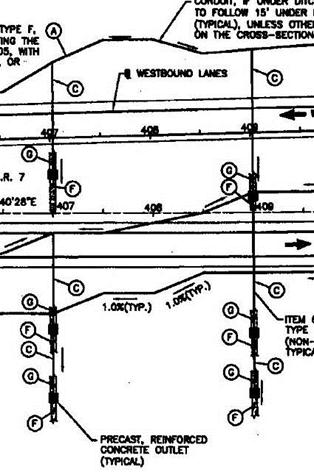
Figure
203.LL – Plan View of Drainage
Spreading and Compacting (203.06)
This section covers a general
description of spreading and compacting materials. A more detailed explanation can be found in
Section 1015 Compaction Testing of Unbound Materials.
The procedures outlined in
this section will make or break the quality of the earthwork construction. Control over the lift thickness and
compaction of the materials is vital to the success of the project.
Certain materials require
compaction at thinner lifts than others in order to obtain their maximum
strength. Other materials can be
compacted in thicker lifts without sacrificing quality. Some materials require the addition of water
to help the compaction effort or to help break down the material, while other
materials require mixing to get the desired results.
All embankment materials,
except for rock in 203.06.C.
and RPCC in 203.06.D,
are spread in horizontal, loose lifts, not exceeding 8 inches (200 mm). All embankment material lifts, except for
rock and durable shale, are compacted to a specified density and moisture
requirement in 203.07.
The material is spread using
dump trucks, scrapers, and dozers. In
general, a footed drum roller is used to compact rock, shale, clay, and silt
material. Granular materials are
generally compacted using a smooth drum vibratory roller.
To record the embankment
construction operations, an inspection sheet was created to help document the
work: the CA-EW-12
Daily Earthwork Inspection Form.
There are several sections to check off on the form that denote project
information, location of the work, type of equipment used, and embankment
operation information. This form should
make it easier for the earthwork inspector to determine what the minimum
inspection requirements are during the earthwork operations.
Soil and Granular
Embankment (203.06.A)
Use a maximum lift thickness
of 8 inches (200 mm) for soil and granular embankment. Compaction acceptance for soil is based on a
percentage of maximum dry density. The
appropriate maximum dry density value is determined from a one-point Proctor
test, one-point Proctor test with aggregate correction, or a test section. Compaction acceptance for granular material
is also based a percentage of maximum dry density, but the maximum dry density
value is always determined from a test section.
These methods for determining
the maximum dry density are covered in Section 1015, Compaction Testing of
Unbound Materials, of this manual.
Shale (203.06.B)
Shale is consolidated
mud. Shale may seem hard, but in many
instances it can be broken down to soil size with very little effort. See 203.02.P and 703.16.D in this manual for
a full description of the material.
Some hard, durable shale can
be excavated or blasted in very large sizes.
Contractors control the size of the material by the way they blast the
material. During the typical rock
blasting operation, the bench height/burden (L/B) ratio is greater than one,
the production hole spacing (S) is 10 to 15 feet (3.3 to 5 m), and the
production hole diameter (D) is 6 inches (150 mm). These dimensions are typical in order to maximize
production. In addition, it generally
leaves large chunks of rock or shale.
These large pieces are fine for rock fills, but are not conducive to
shale fills.
To produce smaller shale or
rock fragmentation, the blaster can increase the L/B ratio to about 3, decrease
S to 6 to 8 feet, and reduce D to about 4 inches (100 mm). These dimensions are changed in a trial and
error method. The most efficient method
depends on the shale and rock formations.
If the Contractor does not
control the material size during the excavation or blasting, the amount of
spreading, manipulation, compacting, and watering will be extensive in order to
get the material into 8-inch (200 mm) lifts.
All shale material is placed
and compacted in 8-inch (200 mm) lifts.
If the material is placed and compacted in thicker lifts, then a
situation such as in Figure 203.MM can occur.
Loose, nondurable shale, intermixed within the lift can later
deteriorate when water runs though the material.
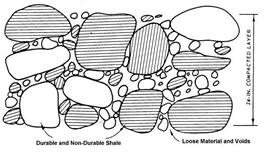
Figure
203.MM – Thick Lift of Shale
In many cases, when thick
lifts are used, the compaction in the top 8 inches (200 mm) may pass. If the top 8 inches (200 mm) is removed, the
lower material is made of loose and large chunks of soft shale.
Figure 203.NN details what
happens when shale is not properly placed and broken down. The embankment load on the shale, along with
the water going through the embankment, can cause the nondurable shale to break
down.
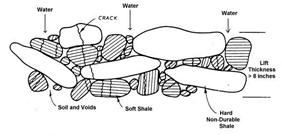
Figure
203.NN – Inadequate Shale Compaction and Breakdown
In order to ensure long-term
durability, the project needs to determine how much to break the shale down in
the field. The amount of breakage during
construction is directly related to the durability of the shale. The durability is correlated to the Bucket
Test and roller pass methods in the specifications.
The specifications require
that the shale be tested for compaction and broken down according to the Bucket
Test and the subsequent roller pass evaluation.
A summary of this evaluation
follows:
- Perform initial test
for durability in 703.16.D (Bucket Test).
- Consult the following:
- If less than 25 percent
is retained on 3/4-inch sieve, then shale should be broken down to soil
size.
- If 25 percent to 75
percent is retained on 3/4-inch sieve, then an even percentage of soil,
small-, and coarse-sized shale are obtained (maximum contact with all
particles). Shale should have a
granular texture when properly broken down in the field (see Figure
203.OO).
- If more than 75
percent is retained on 3/4-inch sieve, field test for hardness
(703.16.D).
- Use six passes with
rollers specified in 703.16 to field test for durability.
- Consult the following:
- If greater than 40
percent breaks down, break material into a granular texture as detailed
in Figure 203.OO.
- If 40 percent or
less breaks down, use the procedure in Section 203.06.B in C&MS
(Durable Shale): 10 passes with a 15 ton roller and fill the voids.
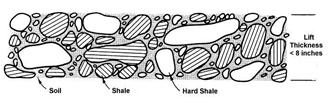
Figure
203.OO – Granular Texture Shale
The above procedure is a
systematic approach to evaluating potential shale breakage in the field. In practice, field results will vary because
of variability of shale and the mixing of different types of shale and
rock. Some judgment is required during
construction.
The most important factors in
the long-term quality of shale fills are:
- Water shale until the
material is at least 2 percent above optimum moisture throughout the lift.
- Manipulate or mix by
dozing until a maximum 8-inch (200 mm), loose lift is achieved. Remove large chunks of shale or rock
that exceed this lift thickness.
- Compact each lift to a
maximum dry density, except for durable shale. Use 10 passes with a 15 ton roller in
203.06.B for durable shale.
- Typically about 5 to
10 passes are sufficient for compaction of nondurable shale.
Rock (203.06.C)
Maximum loose lifts are as
follows:
- Six inches larger than
the largest rock piece with a maximum lift thickness of 3 feet (1 m). Some
examples follow for clarification:
- The maximum rock
size in a 3-foot lift is 2-1/2 feet.
- If the largest rock
size in a lift is 1 foot, then the maximum lift thickness is 1-1/2 feet.
- Near bridges, within a
length of 6 times the height of the fill at the abutment, use less than 18
inch (0.5 m) lifts.
Example: Fill height is 20 feet (6 m), thus within 120 feet of abutment.
(20 × 6 = 120 feet)
The rock fill construction is
outlined below:
- Distribute full width of the
lift.
- Evenly distribute the larger
rocks.
- Reduce the voids.
- Place the smaller rock in the
upper portion of the lift.
- Compact with 8 passes of a 10
ton (9 metric ton) roller.
When using other embankment
materials with rock, use rock as:
- Base of the
embankment. It provides better support.
- On the outer portions
of the embankment. It provides better drainage.
- Place the larger rocks
on the outside side slopes. It provides better drainage.
Use other embankment material
as follows:
- On the inner portion
of the fill.
- Keep the top higher
than the rock.
- Construct wide enough
for compaction.
- When rock is on top of
other embankment material, construct at a side slope grade of 4 percent
prior to placing the rock. This
provides better drainage.
When the rock fill contains
more than 15 percent shale, compact like a shale fill.
Random Material (203.06.D)
Random materials are a wide
variety of materials which do not fit any other groupings. They may be rock mixed with soil, brick,
asphalt mixed with soil, or Portland cement concrete mixed with soil.
Soil mixed with any other
random material must be at least 2 percent below optimum. This will help fill the voids and create a
stable embankment.
Recycled asphalt or concrete
are mixed with at least 30 percent natural materials.
Random material mixtures are
placed in 8-inch lifts, except for RPCC:
- Maximum size of the RPCC is less than 3 × 3 feet (1 m).
- The mix is dozed and
mixed to fill the voids.
- Lift thickness is less
than 12 inches (300 mm).
- Use 18 inch lifts (0.5
m) when the lift is more than 50 percent RPCC.
- Compact the natural
material to a test section maximum.
Compaction and Moisture Requirements (203.07)
Except for granular material
types D and E, rock, and durable shale, the moisture and density controls in
this section apply. Perform all
compaction tests according to Supplement
1015. This supplement is detailed in
Section 1015 Compaction Testing of Unbound Materials.
Moisture
Controls (203.07.A)
Water is added or removed
from a material in order to obtain the necessary density and stability. Note: for embankment material, there is no
explicit range of acceptable moisture content (e.g. within 3 percent of optimum
moisture content). The criteria for
acceptable moisture content are that the Contractor can obtain the necessary
density and stability.
Dry or add moisture
throughout the lift. Expedite and
manipulate the material by using plows or discs. For soils with pronounced elasticity or
deformation, reduce the moisture content to ensure stability.
In a fill situation without a
soft foundation, heavy equipment may deflect the soil, but no permanent rutting
or cracking should be evident afterwards.
Some soils require moisture
contents 5 percent below optimum to ensure stability. Materials such as A-4a, A-4b, and A6a’s are
notorious for this problem. These
materials are difficult to compact during marginal weather conditions and
directly after a rainy day.
The elasticity may be caused
by foundation conditions. See Materials
203.02, Elasticity and Deformation of Soils.
Do not mix shale in the lifts
to reduce the moisture content. The
shale will bring the moisture down, and then break down later causing
settlement or a landslide.
Compaction
Requirements (203.07.B)
Table 203.07-1 details the
Embankment Compaction Requirements. The
percentage is based on the maximum dry density of the soil. This table is used for materials where the
maximum dry density is determined using a one-point Proctor test or a one-point
Proctor test with aggregate correction.
Table 203.B – Embankment
Compaction Requirements
|
Maximum Dry Density (lb/ft3) |
Minimum Compaction Requirements
in Percent of Maximum Dry Density |
|
90 to 104.9 |
102 |
|
105 to 119.9 |
100 |
|
120 and more |
98 |
Test sections are required to
determine the maximum dry density for granular materials and some other
materials. If a test section is used then
the following apply:
- Use at least 98
percent of the maximum dry density obtained in the test section for
acceptance in the production area.
- Use the same number of
passes used in the test section for the production areas. Reduce the number of passes if
detrimental to the compaction.
- Construct a new test
section when the material or supporting foundation changes.
- Reduce the moisture
content if the material becomes unstable.
More detail can be found in Supplement
1015 Compaction Testing of Unbound Materials.
Method of
Measurement (203.09)
This section of the manual
briefly outlines some of the methods used to determine earthwork
quantities. Methods described in this
section are acceptable for making this check.
Many of these methods are outdated due to current GPS (GNSS) systems, but they are still presented.
Specification Requirements
The specifications require
that the average-end-area method be used to determine volumes of earthwork for
payment.
End Area Determinations
There are many acceptable
methods for determining end areas for earthwork computations. Any method that gives accurate determinations
may be used. Some of the most common
methods for determining cross-section end areas are as follows:
Planimeter
In this method, an instrument
with a wheel and a graduated dial is run around the perimeter of a
cross-sectional end area. The area is
found by multiplying the reading on the dial by a constant factor or by setting
a factor on the planimeter and reading the area
directly from the planimeter dial.
Counting Squares
In this method, the number of
unit squares in a section is counted.
This is only practical in very small sections.
Stripping
This is a method of tallying
unit squares by making successive marks on a strip of paper to measure unit
strips, accumulating all unit strips on a cross-section and converting to total
cross-section area. This method is
simple, rapid, and keeps the chance of error to a minimum.
Computer Method
In this method, data from
cross-sections (usually in coordinate form) is input into a computer program,
which follows a program set-up to finish areas and volumes.
CAD
Most plans are developed
using Computer Aided Design (CAD) programs.
The earthwork calculations are detailed in these files. Contact Production for these calculations.
Geometric Method
In this method, the section
is broken into areas, such as triangles and trapezoids. Each area is then calculated by its
geometry. The total area is found by the
sum of the individual areas.
Arithmetic Calculation
This method calculates end
area using a formula. Data for the
formula is taken from a cross-section (or field notes) that show elevation and
distance from a base line for each break in the cross-section line. A pocket calculator can be used for this
calculation.
Determination of
cross-section end areas by this method is exact and any two persons using the
same information (field notes) will obtain the same answer, providing no errors
are made in the calculator manipulation or arithmetic calculations. There is only one correct answer.
The two methods are described
and illustrated in Figures 203.PP and 203.QQ.
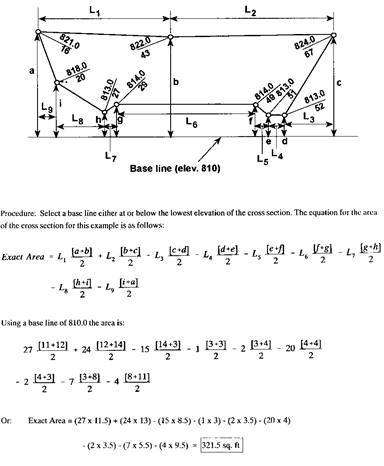
Figure
203.PP – End Area Determination Method 1
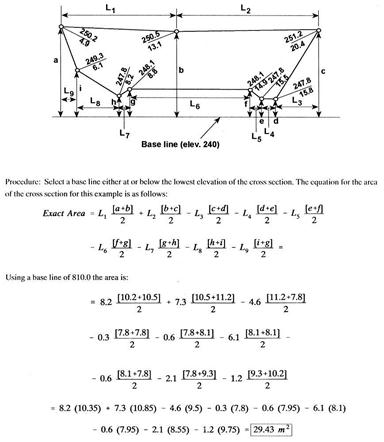
Figure 203.PP-M – End Area Determination Method 1
(Metric)
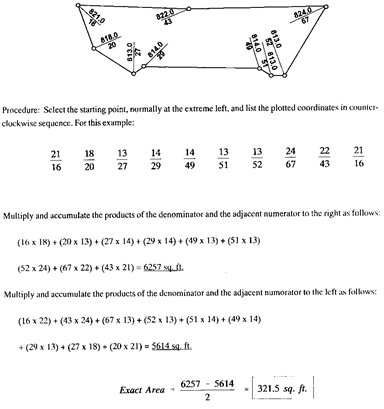
Figure 203.QQ – End Area Determination Method 2
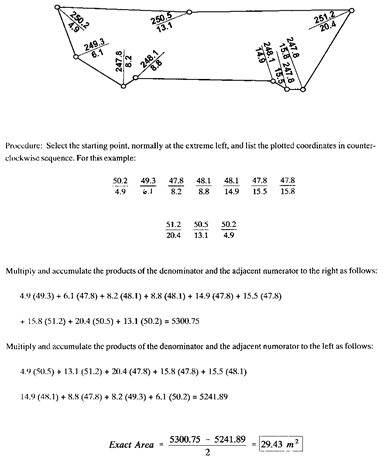
Figure 203.QQ-M – End Area Determination Method 2
(Metric)
Volume
Determination
The end areas of English
plans are detailed in square feet (ft2), while end areas on metric
plans are detailed in square meters (m2). Make the appropriate volume calculation shown
below using the end area found in Figure 203.PP or 203.QQ.
Formula
For base lines and center
lines on tangent, and for center lines on curves where the center line of the
curve coincides with the center of mass (centroid) of the cross-sections, the
formula for computing volume from end areas are as follows:
English Units
![]()
Where
V = Volume in cubic yards (yd3)
A1 = Cross-section one end area in square feet
(ft2)
A2 = Cross-section of other end area in square
feet (ft2)
L = Distance between A1 and A2
in feet (ft)
Metric Units
![]()
Where
V = Volume in cubic meters (m3)
A1 = Cross-section one end area in square meters
(m2)
A2 = Cross-section of other end area in square
meters (m2)
L = Distance between A1 and A2
in meters (m)
Table
Figure 203.RR shows a table
used for determining cubic yards (yd3) from the sum of end areas for
sections 100 feet apart and for conditions described above. This table cannot be used on metric projects.
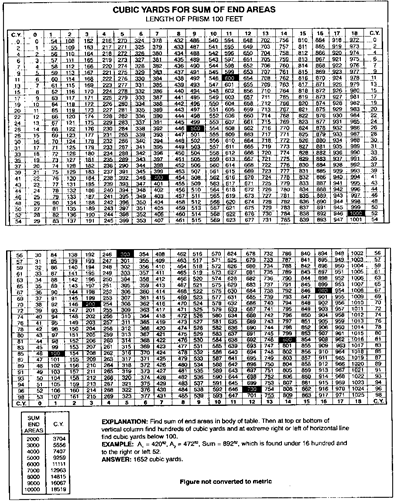
Figure
203.RR – Cubic Yards for the Sum of the End Areas
Earthwork Quantity Calculations
Figure 203.SS Earthwork
Calculations depicts a form that can be used to summarize the earthwork
calculations.
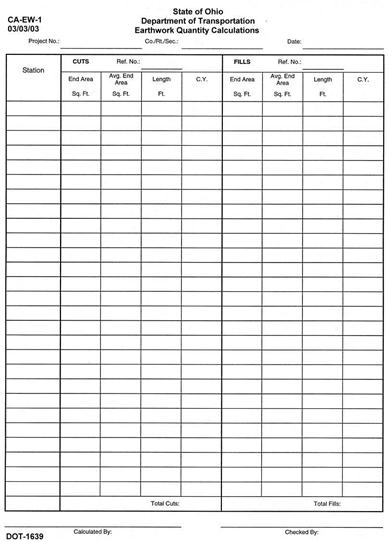
Figure
203.SS – Earthwork Quantity Calculations Form
Figure 203.TT shows a
completed calculation form.
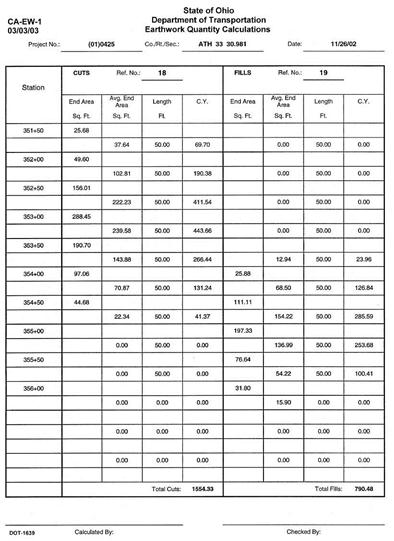
Figure
203.TT – Completed Earthwork Quantity Calculations Form
Volume Determination
on Curves
Where cross-sections are at right
angles to curve center lines, and the center line is not located at the center
of mass (centroid) of cross-sections, corrections must be applied to volume
calculations in order to obtain accurate results. This is especially true for
curves of short radius’s, such as those commonly used on ramps. Inaccuracies of considerable magnitude may
result unless proper corrections have been used in calculating earthwork
volumes. General methods for determining
accurate quantities in such cases are detailed in Section 1310.3.2 and Figure
1310-1 in the Location
& Design Manual – Volume 3, Highway Plans. Links to the Location & Design Manual can
be found on the Design Reference Resource Center on the Department’s website.
Basis of Payment
(203.10)
There are a multitude of
statements that denote when the Department will and will not pay for earthwork
quantities based on different field circumstances. The project should review
this section. In this manual we will
focus on the final quantity measurements.
The GPS (GNSS)
methods are not detailed in Section 203.09 or 203.10 of this manual. Electronic devices connected to graders or
dozers are allowed in Item 623
of the C&MS.
Final Earthwork
Quantities
Check measurements are made
in areas where earthwork is being performed.
A sufficient number of these checks must be recorded according to the
instructions in this manual to provide a satisfactory record of the checks. The purpose of these measurements and records
are:
- To ensure that earthwork is
being constructed to plan lines within specified tolerances.
- To provide a simplified method
of earthwork measurement so that payment may be based on corrected plan
quantities.
This will result in the
savings of engineering man-hours required to arrive at payment quantities and
make it possible for the Contractor to receive prompt final payment after the
completion of the work.
Measurement by Final
Cross-Sections
Final cross-sections of
roadway earthwork are usually not required, provided that the plan quantities
are checked for accuracy and adequate checks have been made (and recorded)
during construction. This establishes
that plan quantities of earthwork have been performed within specified
tolerances.
Final cross-sections may be
called for where, by inspection or other knowledge of the project, it is
indicated that measurement by final cross-section is necessary or desirable.
Procedure for Check
Measurements and Check Calculations:
- Before earthwork
construction has begun, make a plan-in-hand inspection to verify the
ground line shown on the plan cross-sections, and if significant changes
in topography indicate the need for additional cross-sections at
intermediate locations. Where this
inspection indicates the need, arrange for further checks by ground or
aerial survey.
- State in the project
diary that this inspection has been made.
- Ensure that slope
stakes are set by the calculation method.
The initial point for calculations should generally be a profile
grade elevation.
- Obtain a copy of the
survey notes, whether the staking is done by a Department or Contractor
survey crew, and plot horizontal and vertical locations of the slope
stakes on the cross-section sheets. Check the accuracy of original plan
ground cross-sections at slope stake locations. Record errors noted and correct plan
sections promptly.
- Check the accuracy of
the original ground lines shown on plan cross-sections as follows:
- In order to verify
the original ground lines shown on plan cross-sections, the Engineer
shall field check cross-sections every 300 to 500 feet (100 to 150
meters) by either ground or aerial survey methods prior to the beginning
of construction operations. If any
appreciable variations from plan elevations are found, check sections
must be taken at closer intervals in order to determine the extent of
plan errors and amount of additional cross-sectioning required to provide
accurate earthwork quantities. Use
the corrected ground line where plan cross-section lines have been found
in error.
- Plan quantities
resulting from computations that have been properly documented and made a
part of the project records are to be used as final pay quantities. Any
additions to, or deductions from, plan quantities necessitated by change
orders shall be computed by project personnel in order to determine final
pay quantities for adjusted items.
- The Department will
make revisions to the pay quantity for changes for the following:
i.
Total
quantity changes greater than 1,000 cubic yards.
ii.
Two
consecutive end areas varying by more than 5 percent.
iii.
Undercutting.
iv.
Foundation
settlement.
v.
Changes in
the grades or slopes.
vi.
Removing
slides.
vii.
Arithmetic
errors.
- Final pay quantities
computed or adjusted by project personnel shall be checked in the Project
Office of the District Office by competent Department personnel who have
been assigned to the project for construction control, supervision, etc.
- All computations of
adjustments shall be properly validated by the signed initials or names
of persons who computed the adjusted pay quantities and those who
performed the checking operations.
Also, the dates that these functions were performed shall be
indicated. These adjustment
computations shall be made a part of the official project records.
- Where the plan
quantities have been checked and validated on the plans or on computation
sheets provided by the design unit preparing the plans, it is not
necessary during construction to make a detailed check of accuracy of plan
earthwork quantities. If an error
in validated plan quantities is noted, recalculate the end areas and
volumes in question. Check all plan
earthwork quantities for accuracy when plan quantities have not been
checked and validated on the plans or on computation sheets provided by
the design unit preparing the plans.
Especially check locations where there are curves of short radius,
such as ramps. Plan quantities are
frequently in error by significant amounts at such locations. Where plan quantities are not correct,
strike out the plan figures and write in the correct figures. Check the summary to see that quantities
have been transferred accurately from cross-section sheets.
- Make check measurements
during construction to ensure work is being done within allowable field
tolerances. Project personnel
should perform these checks, supplemented by occasional use of the
Department survey crew when needed.
Make sufficient checks to ensure that the work is being performed
within allowable tolerances. The
frequency of these check measurements should be determined by the
Engineer.
- The Contractor is
required to correct all deviations from plan lines in excess of allowable
tolerances as determined by check measurements. During rough grading, it is acceptable
to permit cuts and fills to exceed tolerances by an amount which will be
corrected during fine grading by practical construction methods. In the case of fills, require prompt
corrections of deviations inside allowable tolerances so that specified
compaction of the outer edges will be obtained as the work
progresses. In the case of deep
cuts with steep slopes in rock or shale, prompt correction of deviations
in excess of allowable tolerances is required, so that adjustments can be
made as the work progresses while the slope areas in question are within
reach of the equipment being used.
- Record necessary check
measurements in appropriate notebooks, inspector report forms, or daily
entry in the project diary. These
notations should state the location where check measurements were made.
- Maintain a set of plan
cross-sections in the Project Office.
Plot check measurements, changes, and errors in plan lines on all
projects where there is authorized work beyond plan lines, such as
excavation of soft subgrade. Measurements of this authorized, additional
work are required.
Borrow Pay Quantity
Specifying borrow happens
rarely and only when the measurement in the final location is impractical. An example would be underwater or linear
grading operations. Borrow will be
specified by weight, when practical.
Natural Formations
Volume Measurement
When borrow is specified by
the cubic yard, measurement may be taken in the borrow pit just as in regular
embankment construction. Use the average
end areas.
Only use Department personnel
to take measurements of the borrow material.
Contractor's employees may be used to assist in check measurements and
measurements of authorized excavations beyond plan lines where the quantity at
each location is less than 2,000 cubic yards (yd3) [1,500 cubic
meters (m3)]. This assumes
that project personnel only are responsible for collecting, plotting, and
calculating of the data and quantities.
Weight Measurement
When borrow is specified by
cubic yards, weight measurements may be used to calculate the payment quantity:
- Take a series of
density tests in the borrow areas and average the test results. This value is the wet density, called WD (lbs/yd3).
- Calculate the total
weight from the weight tickets.
This value is called W (lbs).
- Use the following
equation to calculate the payment quantity.
![]()
This can be used as a check
or if cross-sections are not available.
Other than Natural
Formations
Volume Measurement
- Take a series of
density tests in place and average the test results. This value is the wet density, called WD (lbs/yd3).
- Calculate the total
weight from the weight tickets.
This value is called W (lbs).
- Use the following
equation to calculate the payment quantity:
![]()
Weight Measurement
for Borrow
When borrow is specified by
weight use the following:
- Weight tickets minus
excess moisture.
- Collect weight tickets
according to C&MS 109.01.
Adjustment to Borrow
Quantity
The quantity of borrow for
payment is the measured quantity as detailed above minus:
- Suitable excavation
wasted.
- Excess fill adjusted
for shrinkage.
- The shrinkage factor
used is detailed in Section 203.02, Estimating Shrinkage and Settlement,
of this manual.
- Use the following
equation to calculate the payment quantity:
Payment Quantity = SF × Borrow
Quantity
Example:
100,000 CY total borrow, 10,000 CY excess, borrow density is 110 lbs/ft3,
and embankment density 120
lbs/ft3.
Solution:
Shrinkage
Factor, SF=110/120= 0.92
100,000
- 0.92 (10,000) = 100,000 – 9,200= 90,800 CY
Explanation:
Borrow
was measured at the borrow site. A
larger amount of borrow fit into the embankment. Density is greater at the embankment
location. Therefore, we subtract less
borrow from the final pay.
Be careful about which way
you apply the shrinkage factor.
Records
Record all check measurements
and check calculations on the appropriate form, date and sign, or initial the
form, and place it in the project records.
Records of check measurements
must be kept up-to-date at the Project Office during construction and will be
reviewed by the Office of Construction Administration during their routine
visits to the project.
After completion of the
earthwork, prepare a tabulation of earthwork pay items showing plan quantities,
where applicable, and listing appropriate measured quantities for all areas
where there was deviation from plan lines beyond specified tolerances, which
affect the pay quantities, showing total quantities for payment.
This tabulation, together
with records of check measurements, constitutes the earthwork report for the
project. After processing, these reports
shall be filed in the District Office.
Documentation
Requirements - 203 Roadway Excavation and Embankment
1. Materials.
2. Verify plan cross-sections.
3. Cross-sections of borrow site, if required.
4. Classify suspect soils.
5. Foundation.
6. Lifts thickness and roller passes.
7. Equipment used.
8. Type of soils.
9. Take compaction tests according to S-1015.
10. Benching.
11. Verify final cross-sections.
12. Base estimate on yardage from cross-sections, load
count or electronic grade control data.
13. Measure and Pay according to 203.09
and 203.10
14. Document on CA-EW-1,
CA-EW-12 and CA-D-3. Do not
duplicate the information on all forms unless necessary.